
Fibonacci trading helps traders find key price levels where markets might reverse or continue trends. These levels, based on the Fibonacci sequence, include 23.6%, 38.2%, 50%, 61.8%, and 78.6%, with the 61.8% "golden ratio" being especially important for spotting potential market turning points. Here’s what you need to know:
- Fibonacci Retracements: Identify support and resistance during pullbacks.
- Fibonacci Extensions: Set price targets beyond current ranges.
- Key Tools: Combine Fibonacci with moving averages, RSI, MACD, and candlestick patterns for better accuracy.
- Risk Management: Use Fibonacci levels to set stop-losses and profit targets.
- Multi-Timeframe Analysis: Check levels on daily, 4-hour, and 1-hour charts for stronger signals.
Quick Comparison: Fibonacci Tools
| Tool Type | Use | Points Needed | Common Levels |
|---|---|---|---|
| Retracements | Support/Resistance zones | 2 (High/Low) | 23.6%, 38.2%, 50%, 61.8%, 78.6% |
| Extensions | Price targets | 3 (Start, End, Pullback) | 138.2%, 161.8%, 261.8% |
For the best results, pair Fibonacci techniques with high-performance trading setups. Systems like DayTrader Lite, Pro, and Ultra offer fast processing and multi-screen capabilities, ensuring you don’t miss key opportunities at Fibonacci levels.
Learning Fibonacci Pullback and Stretch Levels
Key Fibonacci Ratios and Their Use
Fibonacci ratios come from number splits in the Fibonacci set, and they are key in stock reading. The main pullback spots – 23.6%, 38.2%, 50%, 61.8%, and 78.6% – help find spots where prices may stop or turn during pullbacks. These parts show steady number ways found in nature.
Here’s how we get these ratios: divide a Fibonacci number by the number two places after in the set to get around 0.236 (23.6%). If you split by the next one, you get about 0.618 (61.8%). The 50% part, not from the Fibonacci set, is still seen as a main halfway spot in price moves.
Fibonacci stretch levels, on the other hand, guess price moves that stretch past the first range. Usual stretch parts – 138.2%, 161.8%, and 261.8% – are used by traders to set gain goals when a trend picks up after a pullback.
To find pullback spots in an uptrend, the math is: Pullback = High – (High – Low) x Ratio. For a downtrend, the math changes to: Pullback = Low + (High – Low) x Ratio.
For example, on a one-hour S&P 500 e-mini chart with a high of 6,162.25 and a low of 5,809, the 61.8% pullback spot would be 5,944.00. These exact sums are key to tell pullbacks from stretch spots, which we’ll talk about next.
How Pullback and Stretch Levels Differ
While both pullback and stretch spots use Fibonacci ratios, they have different aims. Pullbacks show how much a price falls back from a recent climb. For example, if a stock goes from $100 to $150, the 61.8% pullback spot shows likely hold around $130, while the 50% spot points to $125.
On the other hand, stretches are used to plan price goals past the current range. To find a stretch, we need three spots: the start (A), the end (B), and a pullback point (C). For an uptrend, the math is: Stretch = Pullback Low + (High – Low) x Ratio. For a downtrend, it’s: Stretch = Pullback High – (High – Low) x Ratio.
Unlike pullbacks needing just two points (high and low), stretches need an extra spot for more exact target plans.
| Tool Type | Use | Points Required | Usual Levels |
|---|---|---|---|
| Retracements | Find when to hold or sell | 2 (top and bottom) | 23.6%, 38.2%, 50%, 61.8%, 78.6% |
| Extensions | Guess next price points | 3 (begin, stop, pullback) | 138.2%, 161.8%, 261.8% |
Why Fibonacci Levels Matter at Big Market Changes
Fibonacci levels work well because many traders watch them. This shared watch makes markets act in ways where these levels become strong hold or break points. When mixed with other market tools, they prove more sure [1].
These points hit harder on big time spans. Here, big price moves pull in more market folk [3]. Big traders also use these levels to set sizes and manage risk, adding to their power in market patterns.
All in all, these levels do best as part of a large plan. Things like candlestick shapes, how much is bought or sold, or speed indicators can show if a market might flip or keep on its path [3].
Simple Guide: Using Fibonacci Levels in Trading Software
Spotting Trends and Key Points
To use Fibonacci retracement well, first find the market trend and key points. These levels are best in markets that move a lot, where you can see patterns more clearly. In an up move, prices usually make higher highs and higher lows. In a down move, they make lower highs and lower lows [5][1].
A high point in the price, with lower highs at both sides, is a swing high. A low point, with higher lows around it, is a swing low [7]. These points are key as they often show when the market might change direction [6]. But, a real swing shift needs the last high or low to be beat, shown as a full candle closing over it. Just touching it with a wick means it might not be a true change [7].
Find the newest big high and low as your base points [1]. They should stand out on your chart so your Fibonacci levels are strong. Mark these points to start doing your Fibonacci lines.
Making Fibonacci Lines on Charts
After spotting the high and low points, the next part is to draw the Fibonacci lines. While the method to do this can change by platform, the basic steps are the same.
- For going up: Draw from the low point up to the newest high [5].
- For going down: Start from the high point and draw down to the newest low [5].
How to do it on some common platforms:
- TradeStation:
- Click the Drawing button (pen shape).
- Choose "Fibonacci Price Retracement Lines."
- Left-click on where to start, hold, move to the end point.
- Click again to set the range.
- NinjaTrader: Use F8 or take the tool from the menu. Draw your lines a bit away from the candles to keep the chart clear.
- MetaTrader: Go to the Insert menu, choose Objects, then Fibonacci. Pick Retracement or Extension based on what you need. The extension is good for seeing how far risks or trends might go with three points: start (A), end (B), and back point (C).
Using Fibonacci Levels with Other Tools
Fibonacci lines work better with other tech tools. Using them alone might give wrong signs [2]. When you add more tools, it helps to find true spots where the market might turn [4].
- Moving Averages: Check for Fibonacci levels that meet with main moving averages, like the 50-day or 200-day. These spots often show good times to buy or sell.
- Relative Strength Index (RSI): A low RSI at a Fibonacci support could mean it’s time to buy, while a high RSI at resistance might show it’s time to sell.
- MACD: A rising MACD at a Fibonacci point when prices are going down could be a sign to buy. A falling MACD when prices go up could be a hint to sell.
- Candlestick Patterns: Shapes like doji, hammer, or engulfing candles at Fibonacci spots can help see a possible trend change.
- Volume Analysis: A jump in trading amount at a Fibonacci spot often backs up its role as a strong support or block place.
Look well at how price moves near Fibonacci points. When a switch has support from other marks or candle forms, it might be a strong sign to start or stop your trades.
Complete Fibonacci Trading Masterclass (Full Course: Beginner To Advanced)
Making Fibonacci Trading Better with Top-Tier Tech
To use Fibonacci ways well, you need very good tech. Old or slow tech can cause you to miss chances or make bad trades. The best setup helps you use your Fibonacci ways well and fast, turning hard plans into real trades.
Main Parts of DayTradingComputers for Fibonacci Trading
Having strong tech is key for using Fibonacci ways right away, most of all when timing is key.
Very low delay is needed. In trading, every tiny bit of time matters. The number of trades done in less than one tiny bit of time grew from 11% in 2019 to more than 17% in 2024 [11]. Quick systems can change the game when markets shift fast.
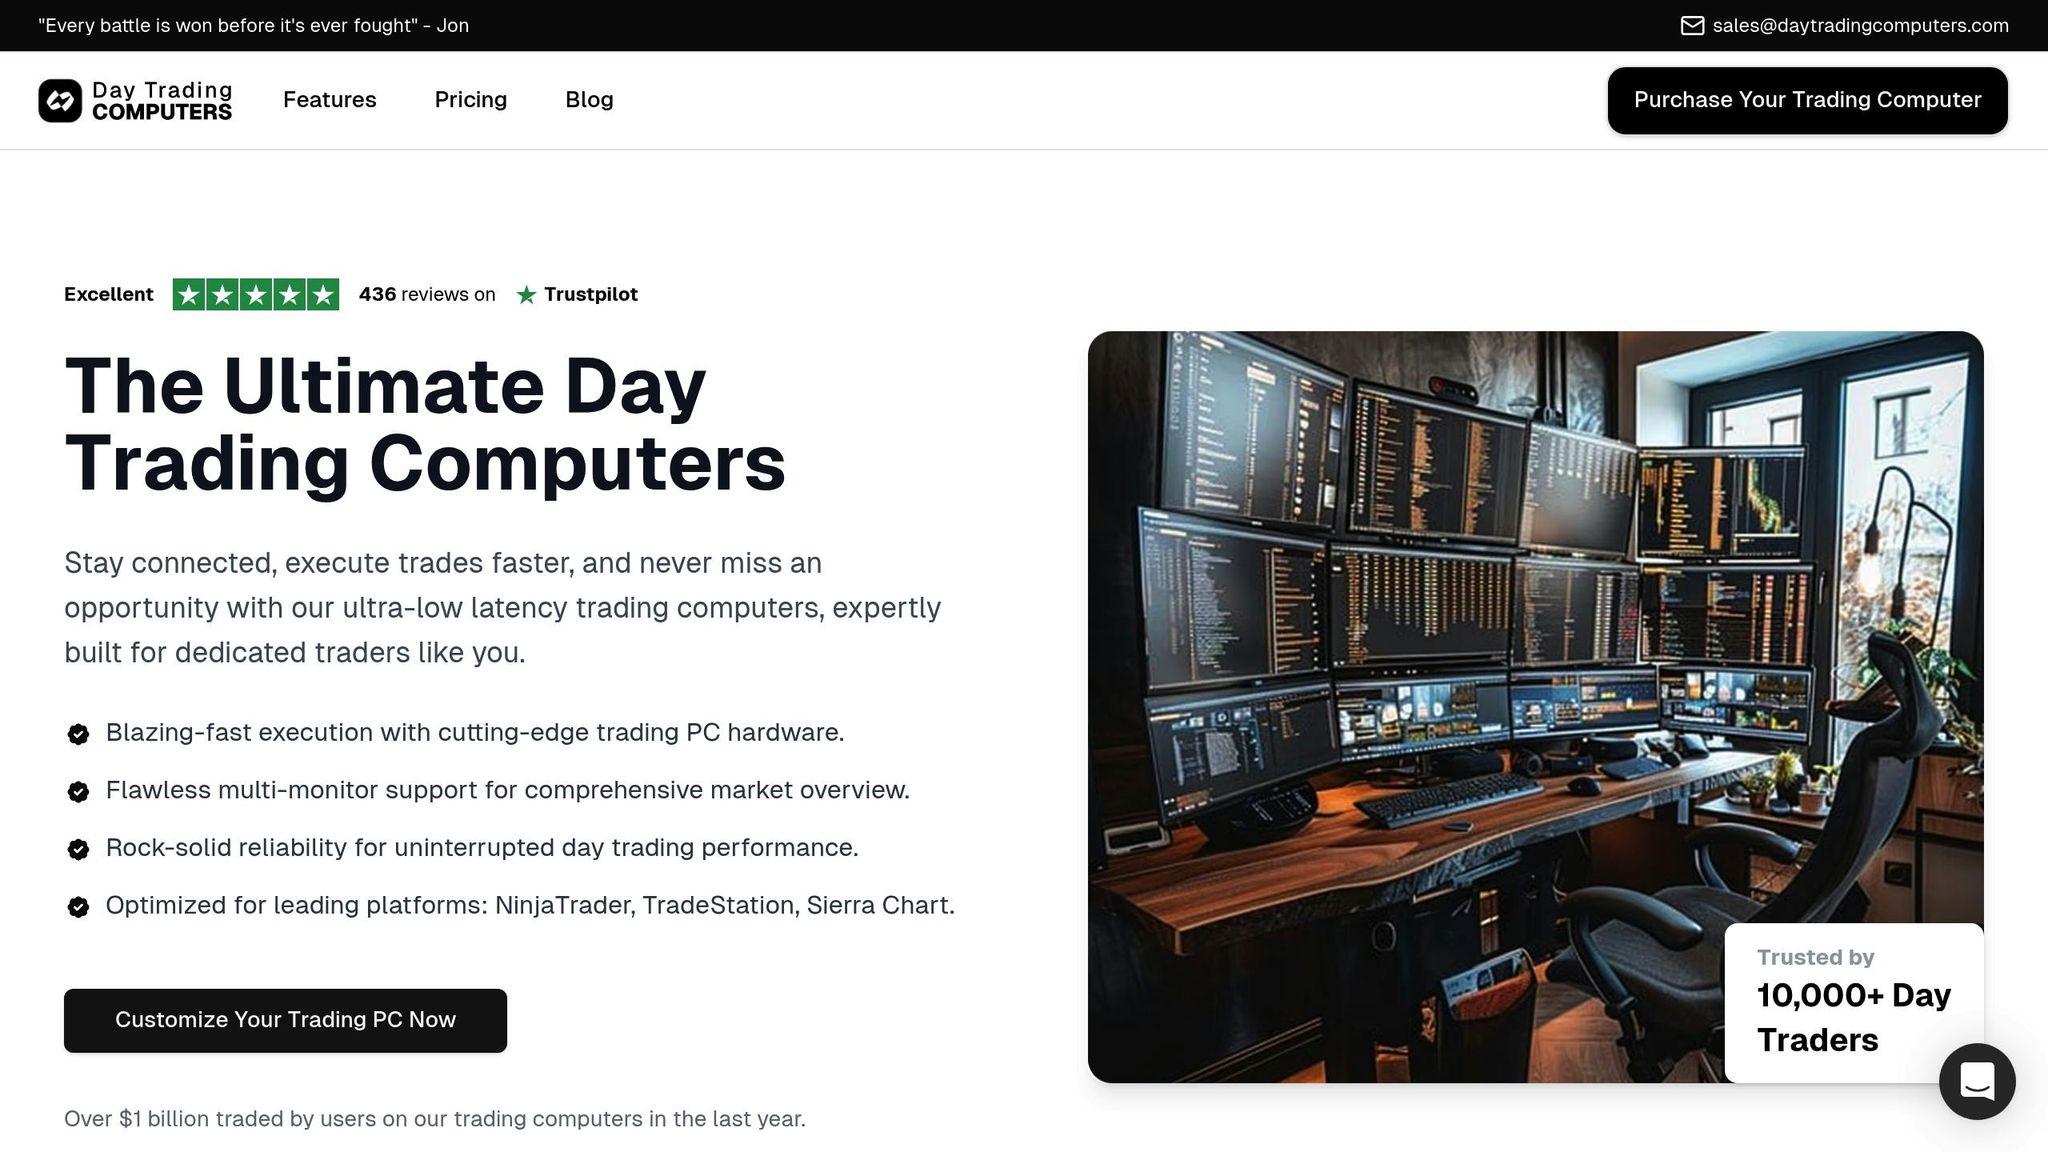
Support for many screens lets you watch Fibonacci levels on many times at once. You might use one screen for a week-long chart to see big trends, another for daily charts that show important Fibonacci levels, and a third for charts of the same day to get your timing right. All DayTradingComputers models can use up to two screens, making it easy to look at different times without hassle.
Quick data handling makes sure your charts are up-to-date the moment the market gets close to an important Fibonacci level, like the 61.8% pull-back. With AMD Ryzen chips in DayTradingComputers, you can run many trading platforms fast and make quicker choices.
SSDs (solid-state drives) make loading times for trading programs and past data much faster. This helps a lot when you switch between charts or look for new symbols for Fibonacci levels.
Comparing Models of DayTradingComputers
DayTradingComputers has models made for different trading needs. Here’s what each offers:
| Part | DayTrader Lite | DayTrader Pro | DayTrader Ultra |
|---|---|---|---|
| CPU | AMD Ryzen 5600X (8 cores) | AMD Ryzen 7900X (12 cores) | AMD Ryzen 9800X3D (16 cores) |
| GPU | NVIDIA GeForce RTX 3070 Ti SUPER | NVIDIA GeForce RTX 4070 Ti SUPER | NVIDIA GeForce RTX 4090 SUPER |
| RAM | 32GB DDR5 5200MHz | 64GB DDR5 5200MHz | 128GB DDR5 5200MHz |
| Hard Drive | 1TB NVMe M.2 SSD | 2TB NVMe M.2 SSD | 4TB NVMe M.2 SSD |
| Cost | $3,569.00 | $4,569.00 | $5,569.00 |
- The Lite model works well for new folks trying out Fibonacci trading, handling one or two setups at once.
- The Pro model is good for more in-depth setups, using many tools and Fibonacci things all at the same time.
- The Ultra model is made for pro traders who need the fastest speed and top results for deep analysis.
Why Good Gear Is Key for Day Traders
In quick markets, even a small slow-down can make you miss an important spot when an asset moves to a Fibonacci level. Low lag helps traders act faster than others when stuff happens [10].
The system must be stable. If your computer stops or hangs at a key time near a Fibonacci spot, it could stop you from handling your risk or getting profits. Top tech helps cut those risks, making sure your trade setups run well [9].
Handling many setups gets easy with strong gear that deals with complex setups fast.
"By moving decision logic from software onto the network via FPGA technology, traders can reduce latency from microseconds to tens of nanoseconds, giving them a competitive edge even if they’re not the fastest in absolute terms." – Milan Dvorak, CEO of Magmio [11]
In the end, a good web link is a must. A wired Ethernet link gives quick and steady web speed [8], this way all your orders go through fast when Fibonacci points are hit.
DayTradingComputers’ top-notch gear make Fibonacci checks quick and sure, helping the sharp choices that Fibonacci trading needs.
sbb-itb-24dd98f
Easy Ways to Use Fibonacci Levels in Day Trading
Fib shares a key part in spotting major change points. Here are some easy ways to bring Fibonacci levels into your day trading plan. With good risk checks, strong setups, and tips from many time views, you can make these tools work well for you.
Risk Control with Fibonacci Levels
Fib levels can be very useful for setting stop losses and profit goals, aiding you in risk control and keeping your trades on track. The key is in knowing just where to set these spots to dodge too soon exits while still keeping risk in check.
Stop-loss setting works best when it’s set just past the next Fib level. For instance, if you buy close to the 61.8% pull-back level, setting your stop loss just under the 78.6% level gives space for small price drops without pushing you out of the trade too soon.
"Fibonacci retracement analysis can be used to confirm an entry-level, target a take profit as well as determine your stop loss level." [12]
Profit goals get clear when you use Fibonacci parts. Points like 100%, 161.8%, and 261.8% set clear stop spots, cutting out guesswork by using numbers. This way also makes it easy to know risk-reward mixes for smarter trade setups.
Fixing how much to trade is easy when your stop loss links to Fibonacci points. After you know your risk per share, fix up your trade size to match your main trade rules.
For more right moves, mix Fibonacci points with new top and low swings when setting stops. This combo makes your risk plan strong and fits with big support and resist zones.
Using Fibonacci with Stops and Holds
Fibonacci works better when it meets firm stop and hold zones. These meet-up spots often give the best start cues, as many parts come together.
Finding meet-up spots means seeing where Fibonacci counts meet key stop or hold points. For example, in EUR/USD trade, the pair went between 1.050 and 1.165, with these matching well with the 0% and 100% Fibonacci back counts. When the price hit 1.17 and went back, traders found a good short play. Also, the jump from 1.05 made a strong long move.
Proof cues bring more trust. Seek out candle patterns, big trades, or big moves at these meet-up spots. These signs help you dodge false starts and bad-timed trades.
Trade checks also get clear when using Fibonacci with stops and holds. For example, you might take some gains at the first Fibonacci part and let the rest of your trade go to the next big hold spot.
"Combining Fibonacci Retracement with Support and Resistance is a great way to enhance your trading strategy." – Nick Quinn, Market Analyst at HowToTrade.com [13]
You need to wait. Let the price hit certain zones and show a clear sign before you make a trade. Also, looking at Fibonacci levels in many time frames can make your plan better.
Using Many Time Frame Analysis
Looking at Fibonacci levels over different time frames gives you a wider look and helps you trade better. When you see the same levels on many charts, they matter more.
Higher Time Frames like daily or weekly show big Fibonacci points that you might not see on shorter charts.
Mid-Level Time Frames, like 4-hour charts, tell you if the main flow will keep going or change at key Fibonacci points. These charts link the big view to your trade.
Lower Time Frames such as 1-hour charts are good for fine-tuning when you get in and out. For example, you see a drop to a Fibonacci level on the daily chart, then check the hourly chart to see the exact time the price starts to go up again.
Here is how it’s used: A trader saw a strong upward move on the daily chart, with the 50-day average over the 200-day one. On the 4-hour chart, a drop to the 50-period average was a good spot to jump in, following the main flow. On the 1-hour chart, a rise in the MACD confirmed the timing. The trader got in during the drop and got out as the 1-hour chart showed new highs.
Matching across time frames makes some trades way better. When Fibonacci points from many time frames come together, those spots are better for strong support or block lines.
A big error is to just look at short-term charts and ignore the big trend. This often means trades go wrong and you lose money. Always look at the big picture first, then zoom in to when you will trade.
While looking at many time frames takes more work and screen space, it is worth it because it helps you find good chances to trade. With the right tools, you can look at many time frames at once and make moves on Fibonacci chances as they come up.
Conclusion: Mastering Fibonacci Trading with the Right Tools
To excel in Fibonacci trading, you need more than just a solid understanding of analytical techniques – you also need the right technology to back you up. Fibonacci levels, such as 23.6%, 38.2%, 50%, 61.8%, and 78.6%, are invaluable for identifying potential support and resistance zones, making them a go-to tool for spotting price reversals and planning trades. These levels frequently show up in live markets, offering traders a reliable framework.
Take the S&P 500 during the COVID-19 crash as an example. The index plunged from around 3,400 to 2,200 in early 2020, only to rebound and test the 38.2% retracement level at 2,647. It then moved on to challenge both the 50% and 61.8% levels[15]. This scenario highlights why Fibonacci tools remain a staple for so many traders – they work, even in volatile market conditions.
Success in Fibonacci trading depends on accurately identifying swing points, drawing levels precisely, and using complementary technical indicators. These levels often act as self-fulfilling prophecies, as traders collectively react to them[15]. However, timing is everything, and having a trading setup that allows for real-time decision-making is just as critical.
This is where high-performance hardware, like systems from DayTradingComputers, makes a difference. Fast data processing, low latency, and the ability to run multiple trading platforms and charting tools simultaneously are essential for staying ahead of the game[2]. For instance, when you’re targeting a bounce at the 61.8% retracement level, even a slight delay can turn a potential profit into a missed opportunity.
DayTradingComputers provides systems designed for traders’ needs. The Lite model, priced at $3,569, comes with 32GB of RAM for simpler setups, while the Ultra model, at $5,569, offers 128GB of RAM for handling more complex analyses. These systems ensure your trading platforms and charting software run smoothly, minimizing the risk of technical glitches during critical moments[2].
The best Fibonacci traders go beyond just using retracement levels – they incorporate multiple timeframes and pair Fibonacci with other technical tools. They set stop-losses just beyond key levels and aim for profit targets at extensions. Most importantly, they integrate Fibonacci into a broader trading strategy that includes sound risk management and trend analysis[14].
Mastering Fibonacci trading isn’t just about practice or strategy; it’s about having the right tools to execute trades with precision. With reliable hardware and a focused approach, you can harness the power of these mathematical relationships to make smarter, more timely trading decisions.
FAQs
How can I combine Fibonacci retracement levels with other technical indicators to improve my trading strategy?
To improve the precision of your trading strategy, try combining Fibonacci retracement levels with other technical indicators. Tools like moving averages, RSI (Relative Strength Index), MACD (Moving Average Convergence Divergence), and trendlines can complement Fibonacci levels by confirming potential price reversals and weeding out less reliable setups.
This approach gives you a broader perspective on market trends, enabling more informed decisions. For instance, if a Fibonacci retracement level coincides with an RSI signal indicating overbought or oversold conditions, it adds weight to the possibility of a price reversal. Likewise, using Fibonacci levels alongside trendlines can help pinpoint strong support or resistance zones, making it easier to determine entry and exit points.
What’s the difference between Fibonacci retracements and extensions, and how can traders use them effectively?
Fibonacci retracements and extensions are essential tools for traders aiming to identify key price levels. Let’s break it down:
- Retracements come into play during market pullbacks. They help traders spot potential support or resistance levels, which can signal where a trend might pause, reverse, or continue. These levels are particularly handy for identifying entry points in a trade.
- Extensions, on the other hand, are used to project where prices might head once the trend picks up again. Traders use these to set profit targets and anticipate future resistance levels, making them great for planning exit points.
Together, these tools work like a map for navigating market trends – retracements guide you on where to enter, while extensions help you plan your exits and set realistic price targets. When used together, they can sharpen your trading strategy and aid in making more informed decisions.
Why is having a high-performance trading computer important for using Fibonacci strategies, and what key features should I prioritize?
Why a High-Performance Trading Computer Matters for Fibonacci Strategies
To effectively use Fibonacci strategies in trading, having a high-performance computer isn’t just a luxury – it’s a necessity. It ensures speedy data processing, seamless chart analysis, and instant trade execution, all of which are crucial for identifying Fibonacci levels and reacting to market shifts in real time.
When selecting the right trading computer, here are the key features to focus on:
- Multi-core processor: Handles complex calculations and large data streams with ease.
- At least 16 GB of RAM: Ensures smooth operation of multiple trading platforms and charts at once.
- High-resolution monitor or multi-monitor setup: Provides crystal-clear visuals for detailed chart analysis.
- Stable and fast internet connection: Reduces latency and prevents delays during trade execution.
Equipping yourself with these tools enables you to keep up with fast-paced markets and maximize the potential of Fibonacci trading techniques.


