
Want to trade smarter, not harder? Understanding price action patterns is your key to making informed day trading decisions. By focusing on real-time price movements, you can recognize patterns that reveal shifts in buyer-seller dynamics, helping you time entries and exits effectively.
Key Takeaways:
- Price Action Basics: Analyze price swings, candlestick behavior, and key levels to track market sentiment without relying on lagging indicators.
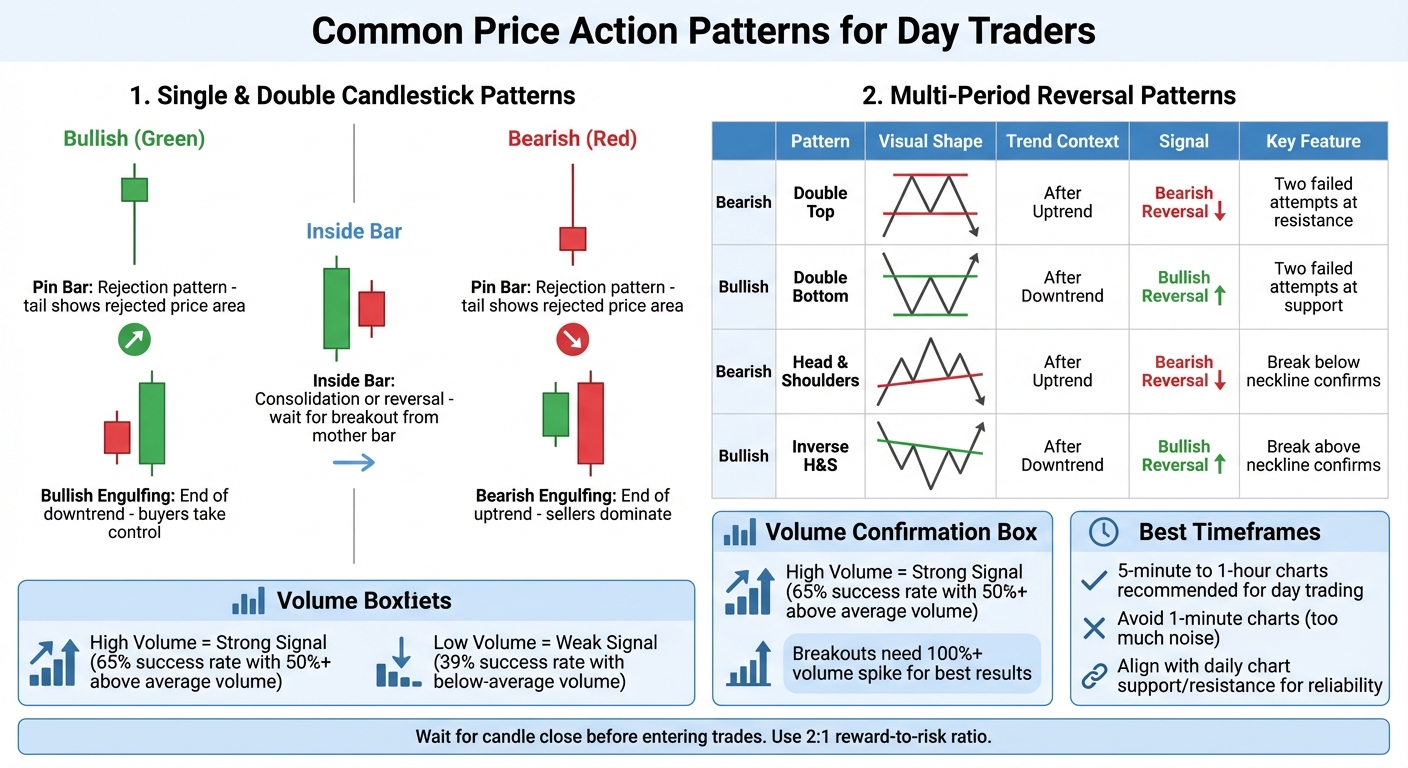
- Common Patterns: Learn to spot pin bars, inside bars, engulfing candles, double tops/bottoms, and head-and-shoulders for trend reversals or continuations.
- Volume and Confirmation: High volume strengthens breakout signals, while low volume often signals fakeouts.
- Trendlines & Zones: Use trendlines and support/resistance zones to identify areas where price is likely to react.
- Risk Management: Stick to a 2:1 reward-to-risk ratio, place stop-losses strategically, and avoid emotional decisions.
Why It Matters:
Price action trading simplifies decision-making by focusing on the "now", rather than relying on outdated data or complex indicators. Mastering these patterns and techniques can help you trade with discipline and consistency, even in fast-moving markets.
Ready to dive deeper? Keep reading for a breakdown of the most effective patterns and tools to refine your trading strategy.
Price Action BASICS – LIVE Day Trading Strategy
Common Price Action Patterns for Day Trading
Common Day Trading Price Action Patterns Comparison Chart
Candlestick patterns offer a window into the tug-of-war between buyers and sellers, helping traders pinpoint potential entry and exit points. Let’s break down some key patterns that day traders often rely on.
Pin Bars and Inside Bars
A pin bar is a single candlestick with a long tail (or wick) and a small body, where the tail is at least twice the size of the body. This tail reflects a strong rejection of a price level. A long lower tail suggests buyers stepped in at lower prices, while a long upper tail shows sellers pushing back at higher levels.
"The tail of the pin bar shows the area of price that was rejected, and the implication is that price will continue to move opposite to the direction the tail points." – Nial Fuller, Professional Trader and Author
Pin bars are particularly effective when they occur at key support or resistance levels or during a trending market. Traders often enter after the bar closes, use a limit order near the midpoint of the tail, or place an entry just beyond the bar’s extreme. The 50% retracement method is popular because prices often revisit the midpoint of a rejection before continuing the move.
An inside bar is a two-candle formation where the second bar’s range is entirely within the first bar’s range. This pattern signals either market consolidation or a potential reversal at significant levels. Traders look for breakouts above or below the "mother bar" to confirm the next move. When an inside bar combines with a pin bar (an "Inside Pin Bar" combo), it’s seen as a strong signal in trending markets. These patterns are most effective on short timeframes, particularly for day trading.
Engulfing Candlestick Patterns
Engulfing patterns are another tool for spotting momentum shifts. An engulfing pattern involves two candles, where the second candle’s body completely covers the first candle’s body. This signals a clear change in market sentiment.
- A bullish engulfing pattern forms at the end of a downtrend, with a small red candle followed by a larger green candle, indicating buyers have taken control.
- A bearish engulfing pattern is the reverse: a small green candle followed by a larger red candle at the top of an uptrend, signaling sellers are dominating.
Confirmation is key when trading these patterns, and volume plays a critical role. High volume during the engulfing candle strengthens the signal, while low volume may indicate a weaker move.
"A breakout on high volume is one of the most obvious indications of a good conviction… low volume breakouts are not followed through and have a greater tendency to break or reverse." – Kyle Maring, HighStrike
For day trading, these patterns work best on 5-minute to 1-hour charts, where they highlight intraday trends while filtering out the noise of 1-minute charts. Aligning engulfing patterns with major support or resistance levels on daily charts enhances their reliability.
Double Tops, Double Bottoms, and Head-and-Shoulders
For more extended reversal signals, traders turn to classic chart patterns like double tops, double bottoms, and head-and-shoulders. These patterns take longer to develop but provide strong indications of trend reversals when confirmed.
- A double top creates an "M" shape with two peaks at a similar resistance level, separated by a pullback. It signals a bearish reversal as buyers fail twice to push prices higher.
- A double bottom forms a "W" shape with two failed attempts to break support, pointing to a bullish reversal.
- The head-and-shoulders pattern features three peaks: a higher central peak (the head) flanked by two lower peaks (the shoulders). The pattern completes when prices break through the "neckline", the support level connecting the two troughs.
| Pattern | Shape | Trend Context | Signal |
|---|---|---|---|
| Double Top | M | After Uptrend | Bearish Reversal |
| Double Bottom | W | After Downtrend | Bullish Reversal |
| Head and Shoulders | 3 Peaks | After Uptrend | Bearish Reversal |
| Inverse H&S | 3 Troughs | After Downtrend | Bullish Reversal |
Confirmation comes when the price breaks the neckline, ideally supported by volume analysis. To avoid false breakouts, wait for one or two sessions after the neckline break to see if the predicted move holds. For example, in a double top, high volume on the first peak and lower volume on the second peak confirm weakening buying pressure.
"The easiest way to confirm any pattern is to do nothing whatsoever. Simply wait for one or two sessions, and watch to see whether the price action predicted by the pattern starts to take hold." – Forex.com
To set profit targets, measure the height of the pattern (peak to neckline) and apply it to the breakout point. Place stop-losses just beyond the pattern’s extreme and aim for a 2:1 risk-reward ratio. These patterns are most effective when they form near major historical support or resistance zones on higher timeframes.
Trendlines, Support, and Resistance Levels
Trendlines and support/resistance zones are the backbone of price action trading. They highlight areas where buyers and sellers are likely to step in, helping traders pinpoint better entry and exit points.
How to Draw and Validate Trendlines
Drawing trendlines is simple: connect at least two key swing lows for an uptrend (serving as support) or two swing highs for a downtrend (serving as resistance). The more times the price touches your trendline without breaking it, the stronger and more reliable that trendline becomes. This repeated interaction reflects a shared market view of value.
To manage risk, place stop-loss orders just below an ascending trendline or just above a descending one. This approach accounts for normal price fluctuations while reducing the chance of being stopped out too early. Start by identifying major levels on daily or hourly charts, then refine your entries using shorter time frames like 15- or 5-minute charts.
"The market’s price movements are the footprints of money. By learning to read these footprints, you follow the path of institutional capital rather than getting lost in the noise." – Colibri Trader
Trendlines also form the basis for chart patterns. For example, an ascending triangle – where horizontal resistance meets upward-sloping support – often signals a bullish continuation. On the flip side, a descending triangle, combining horizontal support with downward-sloping resistance, typically points to bearish continuation. Symmetrical triangles, which show market indecision, usually resolve in the direction of the prior trend.
With these tools in place, the next step is to identify specific zones where market interest is concentrated.
Identifying Support and Resistance Zones
Support and resistance zones build on trendline analysis to fine-tune entry and exit strategies. Instead of focusing on exact lines, think of these areas as zones or ranges where the market has historically shown interest. Drawing rectangles around candlestick shadows can better capture these zones since prices rarely bounce off a single, exact number. Swing pivots – horizontal lines drawn from chart peaks and troughs – are a straightforward way to identify these areas.
For intraday trading, prioritize key levels from the previous session, such as the high, low, and close, as well as the Volume Weighted Average Price (VWAP) and the opening range. Psychological levels like round numbers – $50, $100, or even $80,000 for Bitcoin – often act as natural barriers where traders place limit orders. Additionally, the "Point of Control" from Volume Profile tools, which marks the price level with the highest traded volume, frequently becomes a critical support or resistance zone.
For example, if a stock repeatedly tests a support level near $189 on a 1-hour chart, traders can apply a 2:1 reward-to-risk ratio based on confirmed reversals. When a support level is broken, it often flips to become resistance, and vice versa – this is the polarity principle. High trading volume around these zones signals strong market interest, increasing the chances of a significant price reaction.
Once these zones are mapped out, the focus shifts to confirming breakouts and avoiding false signals.
Breakouts vs. Fakeouts
A true breakout happens when a strong candle closes beyond a key level, ideally accompanied by a noticeable volume increase. Waiting for the candle to close helps filter out market noise. A reliable entry often comes when the price breaks a level and then retests it as new support or resistance.
"When price breaks above a week-long range and pulls back to test that same zone, those buyers are showing up to defend their breakout. That’s your cue." – Christian Harris, Author and Active Trader, DayTrading.com
Fakeouts, on the other hand, occur when the price temporarily moves beyond a level but quickly reverses, often on low volume. Be cautious of these moves – breakouts accompanied by a volume spike are much more likely to hold. Patterns on longer timeframes, like 15-minute or 1-hour charts, are generally more dependable than those on shorter timeframes like 1-minute charts, which are prone to noise. And remember, with a 2:1 reward-to-risk ratio, you only need to be correct 40% of the time to stay profitable.
Confirming Price Action Patterns
Confirming a pattern is crucial to avoid falling for false signals. By combining tools like volume analysis, momentum indicators, and multi-timeframe checks, you can focus on opportunities that have a higher chance of success.
Building on the pattern recognition techniques discussed earlier, confirmation ensures that your trading signals are more reliable.
Volume Analysis for Pattern Confirmation
Volume is like the heartbeat of the market – it reveals the conviction behind price movements. As Cory Mitchell, CMT, explains:
"Price movement is the direction, trading volume is the fuel. Volume tells us how much or little fuel is driving a price move".
A breakout without strong volume often fizzles out quickly. For a breakout to hold momentum, the volume should spike significantly – at least 100% above the 30- to 90-day average. Breakouts with volume at least 50% above average succeed 65% of the time, whereas those with below-average volume succeed only 39% of the time. For instance, in September 2023, Tesla (TSLA) broke out from a $250 consolidation base with a 150% increase in trading volume compared to its 30-day average, resulting in a 30% price surge in the following weeks.
To easily spot volume trends, consider adding a 20- or 30-period moving average to your volume chart. In a healthy uptrend, volume should rise during price advances and fall during pullbacks. Watch out for exhaustion signals – extreme volume spikes often mark the end of a trend. For example, in 2018, the Alternative Harvest ETF (MJ) hit a major price peak accompanied by a massive volume surge – 32 times its prior average – signaling a sharp reversal to the downside.
Using Momentum Indicators
Momentum indicators like RSI and MACD can act as secondary tools to confirm patterns and fine-tune your entries and exits. For example, when a bullish reversal pattern such as a Hammer or Double Bottom forms, check the RSI for oversold conditions (below 30) to increase the likelihood of success.
Confluence is key – setups backed by three or more technical factors have a success rate of 65–80%, compared to 55–60% when only two factors align. As Trading Strategy Guides emphasizes:
"Price Action Is King. Use indicators to show you levels where historically significant price action has occurred and anticipate that similar price action could occur at these same locations".
Avoid jumping into trades based solely on an indicator signal. Instead, wait for the price action pattern to fully form and close. Momentum oscillators can also help you spot when a trend is losing steam, allowing you to take profits before a reversal. Be cautious in low-momentum zones, as they often lead to poor trade outcomes.
Multi-Timeframe Analysis
Using multiple timeframes helps you cut through the noise of random price movements, especially on ultra-short charts. Patterns observed on longer timeframes, like the 15-minute chart, are more reliable because they reflect broader market trends.
Kyle Maring from HighStrike explains:
"An order can be displayed on a lower-timeframe, but an order confirmation by a higher-timeframe can eliminate noise and false signals".
Adopt a top-down approach: begin with a 60-minute chart to identify the overall trend, move to a 15-minute chart to find patterns like bull flags or double bottoms, and then use a 5-minute chart to fine-tune your entries and exits. Ensure that patterns align across timeframes to avoid trading against the primary trend.
Signals from longer timeframes are generally more dependable. Patterns are most effective when they occur near key levels on higher timeframes, such as major support or resistance zones. Be cautious with 1-minute or 2-minute charts – they often generate false signals, requiring strict risk management and quick decision-making.
Applying Patterns and Managing Risk
Once you’ve identified a pattern, the real test begins: executing the trade without letting emotions take over. Building your strategy around confirmed patterns is just the start – disciplined risk management is what ultimately determines success. Make sure the pattern aligns with a key technical level before entering a trade. For instance, a pin bar near a major support level can be a strong signal, but the same pattern in an irrelevant area is meaningless. As Christian Harris aptly says:
"A fancy candle pattern means nothing if it’s in the middle of nowhere. Context is king".
Recognizing Patterns in Real-Time
Always wait for the candle to close before acting to avoid false signals. The first 30 to 60 minutes after major sessions open – like London or New York – often set the tone for the day’s trends. Let this initial volatility settle before committing your capital. Steer clear of the "dead zone", where price action moves sideways without clear direction. During these periods, patterns and indicators are far less reliable.
Markets tend to cycle between periods of expansion (big moves) and contraction (pullbacks). Understanding this rhythm can help you avoid buying when the market is overextended or selling right before a rebound. Use a multi-timeframe approach to refine your strategy: the 60-minute chart outlines the primary trend, the 15-minute chart highlights potential setups, and the 5-minute chart pinpoints your entry.
Once a setup is locked in, the priority shifts to protecting your capital through solid risk management.
Stop-Loss Placement and Position Sizing
Set your stop-loss below key support levels for long trades or above resistance levels for short trades. Position sizing is critical – limit your risk to no more than 1–2% of your account balance per trade. Place your stop-loss at the invalidation point, where the pattern would clearly fail. Use this formula: Position Size = Risk Amount ÷ Stop-Loss Distance. If the trade moves in your favor, trail your stop-loss behind new swing highs (for long positions) or swing lows (for short positions) to secure profits.
Ross Cameron, founder of Warrior Trading, emphasizes scaling with discipline:
"I don’t size up unless I’ve earned it, meaning I’ve already booked $1,000 in profit. If I never get to $1,000 in profit, I remind myself that I will never increase my size. If I go red early, I stay small".
Common Mistakes in Price Action Trading
One of the biggest errors traders make is chasing price after a significant move, which often leads to buying at the peak. Instead, wait for a pullback or a retest of the breakout level. Another common mistake is moving your stop-loss when a trade goes against you – this can turn manageable losses into much larger ones. Focus on high-probability setups and avoid entering trades based on minor price fluctuations.
Overloading your charts with too many indicators can lead to analysis paralysis and conflicting signals. Instead, mark support and resistance as zones – rectangles 10 to 20 pips wide – since price rarely respects exact levels. Keep a trading journal to log trades by session, setup type, and time of day. This will help you identify which patterns work best for your trading style. Finally, if you hit three consecutive losses in a single session, step away to prevent emotional decision-making.
Conclusion
Mastering price action patterns isn’t about memorizing every candlestick formation – it’s about understanding market structure, context, and timing. The patterns discussed in this guide are effective because they reveal the constant tug-of-war between buyers and sellers, helping you adapt to real-time market movements. A study conducted in Brazil highlights a sobering reality: 97% of day traders lose money in the long run, emphasizing the importance of having a disciplined approach and a reliable edge in price action analysis.
Simplicity and consistency are your best allies. Focus on a few high-probability setups that align with key support and resistance levels, and execute them with unwavering risk management. Discipline is the cornerstone of profitability. As Christian Harris aptly puts it:
"Price action trading is just you and the chart. No fancy algorithms. No lagging indicators. Just learning to read the story that each candle is telling you."
Once you’ve honed these techniques, a dependable trading setup becomes indispensable. Execution is just as critical as analysis. A stable, low-latency environment – like the one offered by QuantVPS – ensures you don’t miss opportunities during fast-moving sessions such as the New York open. With QuantVPS, you get the reliability and performance needed to run your strategies seamlessly, whether you’re backtesting patterns or trading live with platforms like NinjaTrader or MetaTrader.
Start by analyzing higher timeframes to determine the trend, then refine your entries on lower timeframes. Always wait for confirmation before entering a trade. These final touches complete the framework for effective and disciplined day trading.
FAQs
How can I effectively use price action strategies in a volatile market?
In unpredictable markets, price movements can often feel erratic. However, focusing on essential patterns like candlestick formations, support and resistance levels, and trendlines can provide a clearer picture. Patterns such as bullish or bearish engulfing formations, pin bars, or inside-day squeezes are worth watching – these often hint at potential reversals during sharp market swings.
When it comes to managing risk, it’s crucial to establish clear entry and exit points near key support or resistance levels. A tight stop-loss just beyond the pattern’s failure zone can help protect your position. Volume also plays a significant role in confirming a pattern’s reliability – breakouts or reversals backed by strong volume are generally more trustworthy, while low-volume moves could signal false starts. By keeping your charts simple and focusing on price action, you can make faster, more confident decisions, even in chaotic market environments.
What’s the difference between pin bars and engulfing patterns in day trading?
Candlestick patterns like pin bars and engulfing patterns are popular tools for spotting potential market reversals. While both serve a similar purpose, they differ in structure and the way they signal changes in price direction.
A pin bar is a single candlestick with a small body and a long wick, which reflects strong price rejection at a support or resistance level. The direction of the wick tells the story: a long lower wick suggests a potential upward reversal (bullish), while a long upper wick points to a possible downward reversal (bearish).
An engulfing pattern, in contrast, involves two candles. A bullish engulfing pattern forms when a large bullish candle completely engulfs the body of the preceding bearish candle, hinting at an upward reversal. Meanwhile, a bearish engulfing pattern appears after an uptrend, as a large bearish candle overtakes the body of the prior bullish candle, signaling a potential downward reversal.
The main differences lie in their structure and emphasis. Pin bars rely on a single candle to highlight price rejection through its wick, whereas engulfing patterns use two candles to showcase a significant momentum shift. Traders often use these patterns to anticipate and act on potential reversals in intraday price movements.
Why is volume confirmation important for validating trading signals?
Volume plays a key role in confirming price movements, as it reflects the level of trading activity behind them. When a price breakout or trend is accompanied by higher trading volume, it indicates stronger market conviction, making the movement more trustworthy.
Using volume as a confirmation tool allows traders to spot legitimate opportunities more effectively and steer clear of false breakouts caused by low activity or market noise. This method not only sharpens decision-making but also enhances overall confidence in trading strategies.


