
Days to Cover (DTC) measures how many trading days it would take for short sellers to exit their positions based on a stock’s average daily trading volume. This metric is critical for understanding short interest risks and identifying potential short squeezes. A higher DTC suggests it will be harder for short sellers to close their positions without driving the stock price up, especially during a price rally.
Key Points:
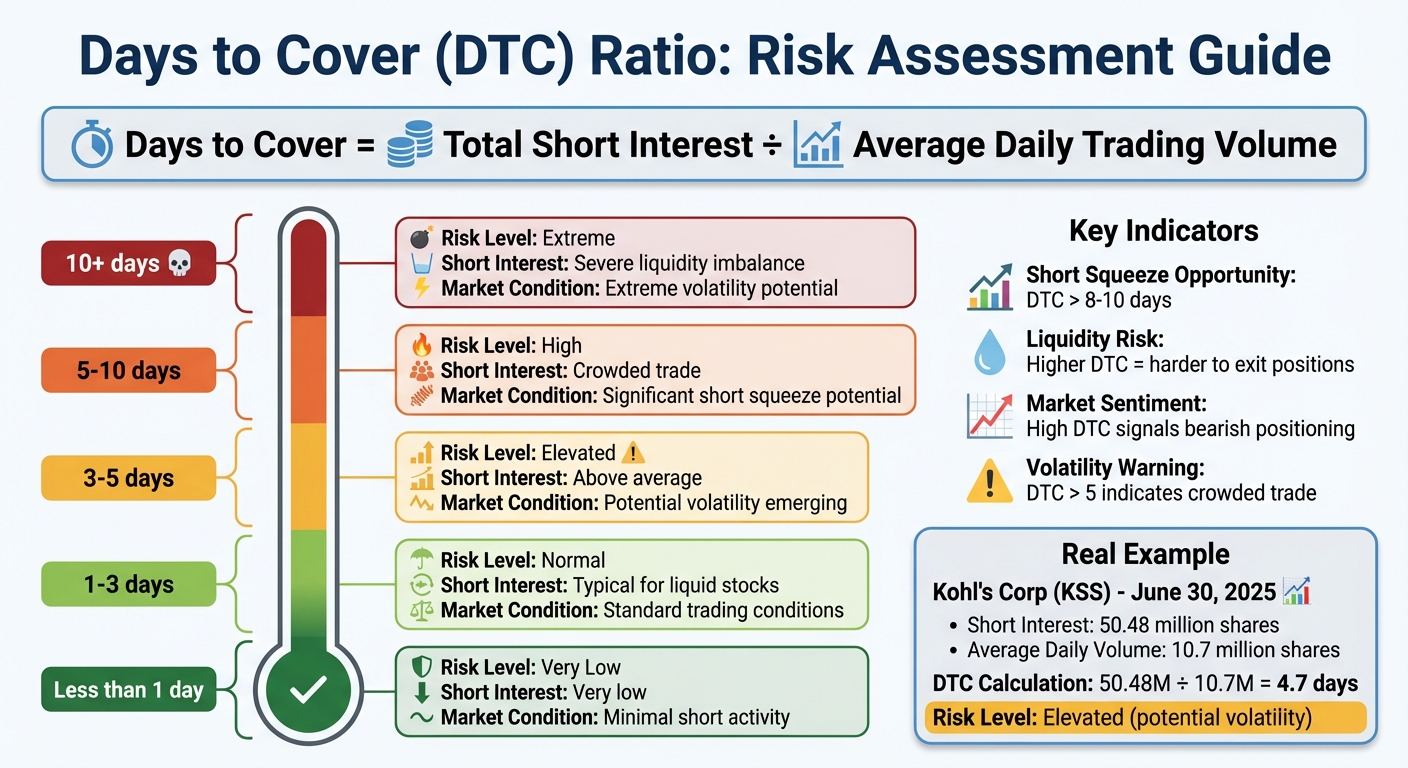
- Formula: DTC = Total Short Interest ÷ Average Daily Trading Volume
- Thresholds:
- Less than 1 day: Low short interest
- 1–3 days: Normal range
- 3–5 days: Elevated risk
- 5+ days: Crowded trade, higher volatility risk
- 10+ days: Severe liquidity imbalance, extreme volatility potential
- Why It Matters:
- Helps spot short squeeze opportunities.
- Indicates liquidity risks for short sellers.
- Reflects market sentiment, with higher DTC often signaling bearish positions.
While DTC is a useful tool, it’s not perfect. Reporting delays and volume variability can limit its reliability. Pair it with other indicators like borrow rates, price action, and technical signals for better insights.
Days to Cover Ratio Thresholds and Risk Levels for Short Interest Analysis
Short Interest and Days to Cover Ratio Explained- How to Easily Find Short Squeeze Candidates
What Is Days to Cover?
Days to Cover is a metric that estimates how many trading days it would take for short sellers to buy back all the shares they’ve sold short, based on the stock’s average daily trading volume. To calculate it, you simply divide the total number of shorted shares by the average daily volume.
"Days to cover is a key metric that helps investors determine how long it would take for short sellers to close their positions, which can indicate the level of short interest in a stock." – Investopedia
This ratio doesn’t just measure the number of shares sold short; it introduces a time factor. For example, a ratio of 2 means short sellers could close out their positions in two trading days under normal volume conditions. In contrast, a ratio of 10 suggests a much longer timeframe, which could create added price pressure during a squeeze.
A high Days to Cover ratio also indicates liquidity challenges. When this number climbs, it shows that short sellers could struggle to exit their positions quickly, especially during a price rally. Essentially, the "exit door" becomes smaller, amplifying risks for those holding short positions.
Understanding Short Interest
Short interest refers to the total number of shares that have been sold short but haven’t yet been repurchased to close those positions. When investors short a stock, they borrow shares to sell them, hoping to buy them back later at a lower price.
This figure often reflects market sentiment. Short interest below 10% of a stock’s float is generally seen as a sign of positive sentiment, while levels above 20% are considered very high. For instance, in 2023, the shorted float for C3.ai rose dramatically from 9.2% in January to 38.2% by December 11. At its peak in November, the company’s Days to Cover hit 6.86, fueling significant volatility.
Short interest data is reported twice a month by exchanges – around the 15th and the last business day. However, it’s usually released to the public 7 to 10 business days later. Because of this lag, traders often factor in recent price movements and volume changes to get a clearer picture of current conditions.
Short interest lays the groundwork for analyzing risks and opportunities, which Days to Cover builds upon.
Days to Cover in Trading
Days to Cover becomes especially important when combined with short interest data, as it helps traders identify potential short squeezes. When a heavily shorted stock starts to climb, short sellers face increasing losses. This pressure forces them to cover their positions, creating additional buying demand that can drive prices even higher.
A notable example occurred in May 2021 with Support.com. The stock’s 8-day ratio, combined with a 78% shorted float and volume surges, triggered a massive short squeeze.
This metric also uncovers liquidity risks that raw short interest numbers might miss. For instance, if 50 million shares are shorted and the average daily volume is 25 million shares, the ratio is 2, which suggests the situation is manageable. However, if the same 50 million shares face an average daily volume of just 5 million, the ratio jumps to 10. This indicates a severe liquidity imbalance, making it much harder for short sellers to exit without pushing prices higher.
Traders often watch for certain thresholds: ratios above 5 to 7 days are considered high, while values exceeding 10 signal extreme imbalances and heightened volatility potential.
How to Calculate Days to Cover
Calculating Days to Cover is simple. You divide the total short interest by the average daily trading volume. The formula looks like this:
Days to Cover = Total Short Interest ÷ Average Daily Trading Volume.
Typically, the average daily trading volume is based on a 30-day period. However, during more volatile times, traders might use a shorter span, like 5 or 10 days, to reflect recent trends. The result represents the number of full trading days it would theoretically take for all short sellers to buy back their borrowed shares, assuming trading volume stays consistent.
Step-by-Step Calculation Example
Let’s break it down with a real example. As of June 30, 2025, Kohl’s Corp. (KSS) had a short interest of 50.48 million shares. Its average daily trading volume for the month was 10.7 million shares. Using the formula:
50.48 million ÷ 10.7 million = 4.7 days
This means it would take 4.7 trading days for all short sellers to cover their positions, assuming no changes in volume.
Here’s another scenario: imagine a stock with 10 million shares sold short and an average daily trading volume of 2 million shares. The calculation is straightforward:
10 million ÷ 2 million = 5 days
This indicates it would take five full trading days for short sellers to exit their positions under normal trading conditions.
These calculations provide a foundation for analyzing what the resulting numbers might mean for market dynamics.
Interpreting the Numbers
The Days to Cover ratio offers valuable insights into a stock’s liquidity and potential price volatility. Here’s a general guide:
- Less than 1 day: Indicates very low short interest.
- 1–3 days: Typical for most liquid stocks.
- 3–5 days: Suggests elevated short interest and hints at potential volatility.
- 5–10 days: Signals a "crowded trade", where even small price movements could trigger a short squeeze.
- Over 10 days: Reflects a significant liquidity imbalance and heightened volatility risk.
Context matters. For one stock, a ratio of 4.7 might be business as usual, while for another, it could be unusually high. To interpret these numbers effectively, compare the current ratio to the stock’s historical average and its sector peers.
Additionally, consider why the ratio is changing. If it’s rising due to growing short interest, it could signal increasing bearish sentiment. But if it’s climbing because of declining volume, it might indicate a "liquidity trap", where short sellers face challenges covering their positions – even if their bearish outlook remains intact.
Why Days to Cover Matters
Understanding the calculation of Days to Cover helps highlight its impact on market behavior. Essentially, this metric shows how difficult it might be for short sellers to exit their positions, often signaling potential for sharp price swings. Higher ratios suggest a more crowded exit, which can lead to increased price volatility.
This figure combines two key elements: the confidence of short sellers (reflected in short interest) and the stock’s liquidity (measured by average trading volume). A high Days to Cover ratio indicates that bearish traders have made significant bets, but limited daily volume could create a bottleneck when they try to exit.
Assessing Market Sentiment
Days to Cover offers a direct glimpse into market sentiment. Many traders interpret values above 5 or 6 days as evidence of strong bearish conviction. When this ratio climbs alongside a rising stock price, it suggests that short sellers are doubling down on losing positions, which could set the stage for sudden reversals. On the other hand, if the ratio rises while the stock price drops, it might mean that short sellers are aggressively increasing their positions, expecting further declines.
This pattern has been seen in several high-profile cases where extreme bearish sentiment led to significant price volatility, often making such stocks prime candidates for short squeezes.
Additionally, if average daily trading volume decreases while short interest remains constant, the Days to Cover ratio increases. This decline in liquidity makes existing short positions riskier and can trigger swift market reactions, often paving the way for short squeeze scenarios.
Identifying Short Squeeze Potential
High Days to Cover ratios are often a red flag for potential short squeezes. When a stock with a ratio above 5 starts to rally, short sellers face a tough choice: hold their positions and hope for a reversal or cover their shorts, which involves buying shares and inadvertently fueling the stock’s upward momentum.
For example, stocks like AMC Entertainment and Support.com have demonstrated how this metric can effectively predict squeeze potential, as discussed earlier.
Studies show that Days to Cover is a more reliable indicator of poor stock performance than short interest alone because it factors in the cost of covering positions. In fact, trading strategies that prioritize DTC as a key metric have delivered monthly returns of 1.2%.
Evaluating Liquidity Risks
Days to Cover also highlights liquidity risks – situations where low trading volume makes it harder for short sellers to exit without significantly affecting the stock’s price. This is particularly crucial for traders dealing with low-volume stocks.
The difference between large-cap and small-cap stocks illustrates this well. A large-cap stock might have 50 million shares sold short but maintain a DTC of just 2 days due to high trading volume. Conversely, a small-cap stock with only 5 million shares short could have a DTC of 10 days because of limited liquidity, making it far more vulnerable to a liquidity-driven squeeze.
Recognizing these liquidity traps through the Days to Cover metric is essential for refining risk management and entry strategies. Experienced traders often keep a close eye on stocks when the ratio exceeds 5 or 6 days, as this typically signals a crowded trade where even minor price changes can lead to significant volatility. Ratios above 10 days indicate a severe imbalance, with a strong likelihood of explosive price movements in either direction. For an entire exchange, a Days to Cover ratio of 5 or higher is often viewed as a bearish signal for the broader market.
sbb-itb-24dd98f
Practical Applications for Traders
Using Days to Cover for Market Analysis
Once you understand how to calculate and interpret Days to Cover (DTC), you can use it to uncover potential trading opportunities. For example, spotting short squeeze scenarios often starts with identifying DTC thresholds. A DTC ratio between 8 and 10 days hints at a higher chance of a squeeze, while anything above 10 days signals extreme volatility risks. But don’t just rely on the numbers – pay attention to how DTC interacts with price movements.
Here’s why: when a stock’s price rises while DTC increases, it could mean short sellers are doubling down on their positions, potentially setting the stage for a squeeze. On the other hand, if the price rises but DTC drops, it usually indicates short sellers are covering their positions. To get a clearer picture of liquidity shifts, consider using 5-day or 10-day dynamic averages.
Take the February 2021 example of Era Group. A trader noticed a 6-day DTC and entered a long position at $6.97 when the Stochastic Oscillator signaled oversold conditions. Within three days, as the oscillator hit overbought levels, the trader exited with a 51% gain.
These strategies demonstrate how DTC can be a powerful tool when combined with other market analysis techniques.
Integrating with Advanced Trading Setups
DTC isn’t static – it can shift daily due to changes in average trading volume. A sudden volume spike, for instance, can drastically lower real-time DTC, signaling a potential short squeeze. Using high-performance trading systems, like those from DayTradingComputers, allows traders to monitor multiple data feeds and catch these shifts in real time.
Pairing DTC with technical indicators like the Stochastic Oscillator or RSI can give you an edge, especially during volatile trading hours. For example, scanning for oversold conditions in high-DTC stocks requires quick processing to act before the window closes. By integrating DTC tracking with advanced charting platforms and screening tools, traders can make faster, more informed decisions, adapting to market changes as they happen.
Refining Risk Management Strategies
Once you’ve integrated DTC into your analysis, the next step is to fine-tune your risk management approach.
High-DTC stocks often come with higher risks. When DTC exceeds 5 days, the trade becomes crowded, and even minor catalysts can lead to sharp price swings. In these cases, it’s crucial to use tighter risk controls. Experienced traders suggest setting stop-loss orders just below key support levels, typically risking no more than 0.5% per trade. Using DTC to identify liquidity imbalances helps with precise stop-loss placement and better risk allocation.
Since the success rate for short squeeze plays hovers between 10% and 20%, maintaining a strong reward-to-risk ratio is critical. Instead of holding out for a full price reversal, consider exiting positions when indicators like the Stochastic Oscillator hit overbought levels (above 80). For example, during AMC Entertainment’s dramatic rally in early 2021, the stock had a 5-day DTC – with over 100 million shares short against a 40-million average daily volume. This led to a six-day surge from $10 to $70. Traders who exited based on technical signals, rather than chasing momentum, were able to lock in their profits.
To strengthen your strategy, confirm DTC signals with other indicators like volume spikes or oscillator shifts. Also, keep an eye on borrow fees; when these fees climb, short sellers may be forced to cover their positions, increasing the likelihood of a squeeze.
Limitations of Days to Cover
Impact of Reporting Delays
The Days to Cover (DTC) metric depends on short interest data that’s only reported twice a month – usually on the 15th and the last business day. However, there’s a 7-business-day lag before this data becomes available. This means traders are often looking at information that’s already 2 to 4 weeks old, which can make it unreliable for fast-moving markets. By the time the data is published, short sellers might have already adjusted their positions, leaving traders in the dark about current conditions.
"Short interest reports… are not timely and may not reflect current market conditions" – Investopedia
In addition to reporting delays, changes in trading volume also affect the reliability of DTC calculations.
Volume Variability
DTC calculations assume that trading volume stays consistent, but real-world markets rarely behave that way. Since the metric is based on average daily trading volume, it doesn’t always align with actual trading activity. For example, a stock’s DTC ratio can climb simply because trading volume has dropped – not because more shares are being shorted.
Take the January 2021 GameStop frenzy: the DTC ratio fell from 2.5 to 0.7 as trading volume surged, enabling short sellers to cover their positions much faster than historical averages suggested. Similarly, AMC Entertainment’s DTC dropped to 0.6 on January 15, 2021, even as buying pressure increased. These examples highlight how volume spikes can make static DTC metrics misleading.
But outdated data and volume swings aren’t the only challenges – other metrics are needed to get a clearer picture.
Complementary Metrics
A high DTC ratio alone doesn’t automatically lead to a short squeeze. Stocks can remain heavily shorted for long periods without any significant price movement. To better interpret DTC, traders should combine it with other indicators like borrow rates, margin interest, and share availability.
For example, Tesla‘s short interest was high in 2020, but other factors – such as rising borrow costs – helped explain why short sellers lost approximately $40 billion that year. Similarly, in 2023, short interest in C3.ai (AI) rose from 9.2% to 38.2% of float, with DTC peaking at 6.86 in November. Traders who focused solely on DTC overlooked key details, including increasing borrow costs and shifts in institutional sentiment.
"Days to Cover should never be used as a standalone indicator. It must be combined with fundamental analysis, technical analysis, and other metrics for comprehensive market assessment." – StockTitan Research Team
To make informed decisions, traders must recognize the limitations of DTC and use it as part of a broader, more nuanced approach to market analysis.
Key Takeaways
Days to Cover (DTC) is a handy metric for assessing market sentiment and spotting potential short squeeze opportunities. A DTC ratio of 8 days or higher often signals that short sellers might face challenges exiting their positions quickly, which could lead to significant price swings. However, it’s not without its flaws – reporting delays of 2 to 4 weeks and variations in trading volume mean DTC should be paired with other tools for better accuracy.
For example, combining DTC with technical indicators like the Stochastic Oscillator or RSI can help confirm entry points. A notable case occurred in May 2021 when Support.com hit an 8-day DTC with short interest at 78% of its float, paving the way for a short squeeze. This highlights the importance of timely execution and practical application when leveraging DTC insights.
To make the most of high-DTC setups, having access to real-time data and quick execution tools is critical. Short squeezes often bring extreme volatility, with small-cap stocks frequently seeing price jumps of 15%–20%, and in some cases, even exceeding 50%. Real-time trading platforms can help you stay agile during these rapid market shifts.
For a more comprehensive view, monitor DTC alongside borrow rates, options flow, and price action. While DTC can pinpoint pressure points, it’s wise to wait for triggers like earnings reports or sudden volume spikes before acting. By following this disciplined strategy, DTC becomes more than just a number – it becomes a valuable tool for managing risk and timing trades with higher probability.
Incorporating DTC into your trading approach can improve risk management and trade timing, making it a key part of a well-rounded market strategy.
FAQs
What is Days to Cover, and how can it help spot potential short squeezes?
Days to Cover measures how long it would take for short sellers to repurchase all borrowed shares, based on the stock’s average daily trading volume. This metric is particularly useful for spotting potential short squeezes. Why? Because a higher Days to Cover suggests short sellers could face challenges exiting their positions quickly if the stock price spikes.
When this number climbs, it signals increased risk for short sellers and a higher likelihood of a short squeeze. Traders often rely on this information to gauge market sentiment and fine-tune their strategies, especially when dealing with stocks that are heavily shorted.
What are the drawbacks of relying solely on Days to Cover in short interest analysis?
While Days to Cover offers a helpful way to gauge short interest, it has its limits when used in isolation. This metric simply estimates how many days it would take for short sellers to close their positions based on the average daily trading volume. However, it doesn’t factor in influences like market conditions, breaking news, or sudden changes in short interest. Plus, fluctuations in trading volume can make the calculation less dependable since it relies on an assumed steady average.
Another drawback is that Days to Cover doesn’t shed light on the reasons behind short positions. Are these trades speculative, or are they part of a hedging strategy? It also doesn’t highlight potential triggers, like news events, that could spark a short squeeze. For a better understanding of market dynamics, traders should pair this metric with other tools, such as short interest ratios, trend analysis, and news monitoring. Together, these can provide a fuller view of the market landscape.
How can traders use Days to Cover with other tools to improve their strategies?
Traders often use Days to Cover (DTC) alongside other market analysis tools to better understand market sentiment and uncover potential trading opportunities. DTC measures how many days it would take for short sellers to close their positions based on the current trading volume. This makes it a key metric for identifying bearish sentiment and spotting the potential for short squeezes.
When combined with technical analysis tools – such as price trends, volume changes, and momentum indicators – DTC becomes even more insightful. For example, a high DTC paired with increasing trading volume and bullish price patterns might signal an upcoming short squeeze. This kind of scenario can help traders decide when to adjust their positions or manage their risk more effectively.
Adding fundamental analysis into the mix, like tracking short interest ratios or staying updated on news events, provides a broader perspective. A rising short interest ratio together with a high DTC could point to heightened short-selling activity. If this is followed by positive news or increased buying pressure, a short squeeze may occur. By combining these tools, traders can fine-tune their strategies, improve their entry and exit timing, and set smarter stop-loss levels in fast-moving markets.


