
Bullish chart patterns help traders identify potential upward trends in the market. These patterns, such as the Double Bottom, Ascending Triangle, Cup and Handle, Bull Flag, and Inverse Head and Shoulders, signal shifts in momentum or continuation of trends. When combined with volume and momentum analysis, these patterns can improve trading accuracy and returns. For example:
- Double Bottom: A "W" shape marking a reversal from a downtrend. Success rate: ~78.55%.
- Ascending Triangle: Flat resistance with rising support. Success rate: ~70%.
- Cup and Handle: A "U" shape followed by a dip. Success rate: ~65%.
- Bull Flag: A sharp rise followed by consolidation. Success rate: ~65–70%.
- Inverse Head and Shoulders: A reversal pattern with three dips. Success rate: ~68%.
Using high-performance trading hardware can enhance real-time pattern detection, ensuring faster and more precise decision-making. For traders, recognizing these patterns, validating breakouts with volume, and leveraging the right tools can lead to better trading outcomes.
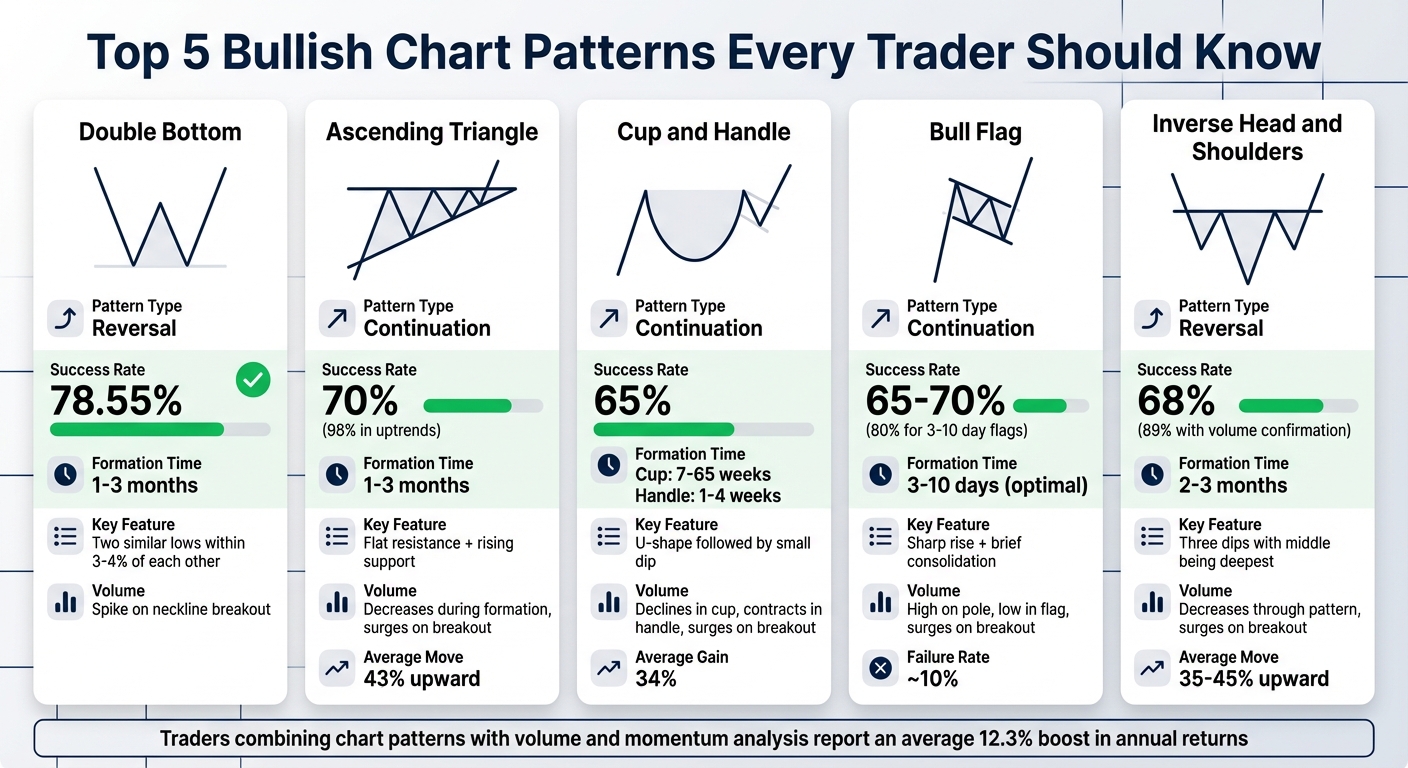
Top 5 Bullish Chart Patterns: Success Rates and Key Characteristics
The Complete Chart Patterns Course (From Beginner to Profitable)
1. Double Bottom
The Double Bottom is a bullish reversal pattern that marks the transition from a downtrend to an uptrend. Its defining feature is the "W" shape, created by two similar lows separated by a peak, known as the neckline. This pattern indicates that sellers tried but failed to push prices lower twice, giving buyers the opportunity to take control. For the pattern to be considered valid, the two lows should ideally be within 3% to 4% of each other. On daily or weekly charts, it typically takes one to three months to form.
Pattern Type
The Double Bottom reflects a shift in momentum from selling to buying pressure. Its "W" shape is formed by two nearly identical lows, with a peak in between that serves as the neckline.
Volume Confirmation
To confirm the pattern, look for a spike in trading volume when the price breaks above the neckline. According to Investopedia, this volume increase is a key validation factor.
Breakout Signal
The Double Bottom is confirmed when the price closes above the neckline, which represents the resistance level between the two lows. It’s important to wait for a confirmed daily close above this level rather than acting on a mere touch, as this reduces the chance of a false breakout. For instance, in April 2025, Nasdaq-100 futures formed a Double Bottom when the price hit a support level near 16,500 twice before rallying. The breakout occurred when the price surpassed the neckline at 17,200 with strong volume, offering an entry point near 17,250. Conservative traders often prefer to wait for the price to retest the neckline – now acting as support – before entering a trade.
Once the breakout is confirmed, you can calculate the profit target for the trade.
Profit Target Calculation
To estimate the profit target, measure the vertical distance between the bottoms and the neckline. In the Nasdaq-100 example, this distance was 700 points. Add this to the breakout price of 17,200 to project a target of approximately 17,900. To manage risk, place a stop-loss just below the second low. In this case, the market eventually reached the projected target. Double Bottom setups are reported to have a success rate of around 78.55%.
2. Ascending Triangle
The Ascending Triangle is a bullish chart pattern that signals buyers gaining momentum during a consolidation phase. You can spot it by looking for a flat resistance level at the top and a rising support line at the bottom. This pattern forms when the price touches at least two swing highs and two higher swing lows consecutively.
Typically, an ascending triangle takes one to three months to fully form and has an accuracy rate of about 68%. However, when it develops within an existing uptrend, the chances of continuation soar to nearly 98%. A great example is Amazon (AMZN) in mid-2022. The stock confirmed the pattern by breaking above resistance on July 18, triggering a notable rally. After identifying the pattern, the next step is to analyze volume behavior to ensure the breakout is genuine.
Volume Confirmation
During the formation of the triangle, volume usually decreases but then surges when the breakout happens. This volume spike indicates growing interest and helps minimize the risk of a false breakout or a bull trap. The role of volume in confirming breakouts here is similar to what we discussed in the Double Bottom section.
Breakout Signal
A valid breakout occurs when the price closes above the resistance level with strong volume. Some traders prefer to wait for a retest – where the previous resistance turns into support – before entering a trade. For risk management, consider placing a stop-loss below the rising trendline or the most recent swing low.
Profit Target Calculation
To estimate your profit target, measure the height of the triangle (the distance from the flat resistance to the lowest low) and add that to the breakout price. For example, if the height is $15 and the breakout happens at $100, your target would be $115. According to Bulkowski, this pattern has a 70% success rate and typically sees an average price move of 43% upward.
3. Cup and Handle
The Cup and Handle is a bullish chart pattern that signals a continuation of an existing uptrend. It forms when the market takes a pause during an upward movement, creating a distinct "U" shape (the cup) followed by a smaller downward drift (the handle). The cup itself typically forms over a period of 7 to 65 weeks, while the handle develops in a shorter span of 1 to 4 weeks. This pattern is most reliable when it follows a strong uptrend of at least 30% before the cup begins to take shape. Once the handle completes, the pattern often leads to a breakout, continuing the prior trend.
A classic example of this pattern occurred with DISH Network during 2011–2012. The cup had a depth of about $5.99, measured from its $32.25 peak to the $26.26 bottom. In late 2012, the stock broke above the $32.25 resistance level with high trading volume. By April 18, 2013, the stock reached its initial target of $38.24 and ultimately rose by 146.2% from the breakout point. Historically, this pattern has a 65% success rate for upward breakouts and delivers average gains of 34%.
Volume Confirmation
Volume plays a crucial role in validating the Cup and Handle pattern. During the formation of the cup, trading volume should gradually decline, reflecting reduced selling pressure. As the handle forms, volume typically contracts further, signaling that the dip is driven by profit-taking rather than a trend reversal. When the breakout occurs, traders look for a significant surge in volume – usually 40–50% above the average – to confirm the move.
Breakout Signal
A breakout is confirmed when the price closes above the resistance line formed by the rim of the cup and the upper boundary of the handle. It’s important to wait for a strong close above this level with notable volume rather than reacting to an intraday spike. Ideally, the handle should retrace no more than one-third of the cup’s depth; a retracement exceeding 50% often indicates the pattern is failing [27, 29]. To minimize risk, traders typically place a stop-loss just below the lowest point of the handle.
Profit Target Calculation
Once the breakout is confirmed, traders calculate a profit target by measuring the vertical distance from the cup’s bottom to the breakout level and adding it to the breakout price. For instance, if the cup depth is $10 and the breakout occurs at $50, the target would be $60. About 68% of successful breakouts reach this initial target. For those aiming for extended gains, secondary targets are often set at 1.5 to 2 times the cup’s depth.
sbb-itb-24dd98f
4. Bull Flag
A bull flag is a continuation pattern that emerges during strong uptrends, acting as a brief pause before the trend resumes. This pattern has two main parts: the "flagpole", which is a sharp and nearly vertical price increase, and the "flag", a consolidation phase that typically slopes slightly downward or moves sideways. During this consolidation, early buyers often lock in profits while new buyers wait for confirmation of the next move.
Bull flags are known for their reliability, with breakout success rates of around 65%–70% and a failure rate of approximately 10%. A great example is Tesla (TSLA) in 2020. During a major rally, Tesla formed a textbook bull flag. The flagpole showcased a near-vertical price surge on high trading volume, followed by a neat, downward-sloping consolidation. Afterward, the breakout led to a sustained upward trend over the next three months.
Pattern Type (Continuation)
Bull flags are strictly continuation patterns, reinforcing the existing uptrend rather than indicating a reversal. To be valid, the consolidation phase of the flag should be relatively short compared to the flagpole, typically lasting between 3 and 10 days on daily charts. This setup yields a success rate of nearly 80%. If the consolidation lasts too long – over three weeks – or if the retracement exceeds 50% of the flagpole’s height, it could signal a potential trend reversal instead.
Volume Confirmation
Volume plays a critical role in confirming a bull flag. The flagpole should form on significantly higher-than-average volume, signaling strong buying momentum. During the flag’s consolidation phase, volume usually dips but should surge again when the breakout occurs. A decisive increase in volume at the breakout point further validates the pattern, with success rates climbing to approximately 85%.
"Volume is the market’s truth serum. It reveals the real conviction – or lack thereof – behind any price move."
Breakout Signal
The breakout is confirmed when a candle closes firmly above the flag’s boundaries. Kristoff De Turck explains:
"The first candle that breaks out and can close outside the limits of the pattern is proof that the pattern exists and that it can be observed on the chart. Until that happens, there is only the possibility of the pattern."
It’s essential to wait for a full candle close outside the flag before entering a trade. To manage risk, place a protective stop-loss just below the lowest point of the flag’s consolidation.
Profit Target Calculation
To calculate the profit target, add the height of the flagpole to the breakout level. For instance, if the flagpole is $15 tall and the breakout occurs at $60, the initial profit target would be $75. For traders aiming for extended gains, Fibonacci extensions can help refine targets – such as aiming for 1.618 times the flagpole’s length. A practical approach is to sell half of the position at the first profit target and adjust the stop-loss to breakeven, allowing for further potential upside. This strategy highlights the importance of precision and preparation in capitalizing on quick market moves, a concept further explored in the next section.
5. Inverse Head and Shoulders
The inverse head and shoulders is a classic bullish reversal pattern that signals the shift from a downtrend to an uptrend. It consists of three distinct dips: the left shoulder (an initial low), the head (the deepest low), and the right shoulder (a higher low that doesn’t drop as far as the head). The "neckline" connects the peaks between these dips, and when the price breaks above this line, the pattern is confirmed [46, 52]. Its structured design and volume signals help traders make informed decisions, similar to other patterns we’ve discussed.
Between July 19 and August 24, 2023, the Invesco QQQ Trust (QQQ) showcased this pattern on a 15-minute chart following an 8.57% decline. The head reached a low of $354.70, while the right shoulder formed at $360.68. On August 21 at 1:15 PM, QQQ closed above the neckline, triggering a projected target of $370.66, which was achieved during a rally on August 24. Historically, this pattern breaks upward about 68% of the time, with price increases ranging from 35% to 45% after a valid breakout [48, 52].
Pattern Type (Reversal)
This pattern is strictly a reversal signal, marking a shift from bearish sentiment at the head to cautious optimism at the right shoulder, and eventually to bullish confidence upon breakout. It typically takes 2 to 3 months to fully develop and is more reliable on daily or weekly charts [15, 46, 52]. Moreover, a neckline that slopes upward is generally seen as a stronger and more reliable indicator than one that slopes downward [48, 52].
Volume Confirmation
Volume plays a critical role in validating this pattern. It often decreases from the left shoulder through the head, hitting its lowest point at the right shoulder. A noticeable volume surge during the breakout is essential to confirm buyer enthusiasm. Without this spike, the pattern is considered invalid [46, 51].
"Without volume confirmation, this pattern is NOT VALID." – Lucien Bechard, Author and Trader, Bullish Bears
When volume confirmation is present, the success rate of this pattern can climb to 89%. Without it, the success rate drops significantly to just 26% [52, 56].
Breakout Signal
The breakout phase is where the main buy signal occurs. This happens when the price closes above the neckline on increased volume. Some traders prefer to wait for a retest, where the neckline transitions into a support level, before making their move. Such retests occur in approximately 45% to 58% of cases [48, 52]. To manage risk, a stop-loss should be placed just below the right shoulder. If the price dips below this level, the bullish reversal is invalidated [47, 49].
Profit Target Calculation
To calculate the profit target, measure the vertical distance from the head’s low to the neckline and add it to the breakout price [46, 49]. For instance, if the head is $30 below the neckline and the breakout happens at $200, the profit target would be $230. Historically, about 67% of successful breakouts reach the calculated target. Always aim for trades with at least a 2:1 reward-to-risk ratio relative to the stop-loss.
How Trading Hardware Improves Pattern Recognition
Spotting chart patterns in real time is no small feat – it demands split-second data processing, and that’s where high-performance hardware makes all the difference. Identifying bullish formations like the inverse head and shoulders or cup and handle requires hardware capable of handling massive amounts of data at incredible speeds. Low-latency processing and multi-monitor setups give traders the tools they need to stay ahead of the curve.
At the heart of this capability is raw processing power. Systems with up to 24 cores and turbo clock speeds reaching 6.0GHz are designed to handle complex calculations instantly. This level of performance is crucial for running algorithmic scanners and pattern recognition software. For instance, if a double bottom begins to form and volume spikes, every second matters. Slow hardware can mean missing the ideal entry point – or exiting too late.
Multi-monitor configurations take this efficiency a step further. By using multiple screens, traders can monitor different chart timeframes at once. Imagine tracking the overall trend on a 1-hour chart while fine-tuning your entry on a 5-minute chart. This setup eliminates the need to constantly switch windows, reducing mental strain and ensuring you catch critical signals as they appear. When paired with robust processing power, this combination ensures you’re always ready to act.
DayTradingComputers offers hardware built specifically for these demands. They provide three models:
- Lite: $3,569.00, equipped with 32GB DDR5 RAM and a 1TB NVMe SSD.
- Pro: $4,569.00, featuring 64GB DDR5 RAM and a 2TB NVMe SSD.
- Ultra: $5,569.00, boasting 128GB DDR5 RAM and a 4TB NVMe SSD.
Each model supports dual monitors and comes pre-configured for popular trading platforms, making them a solid choice for serious traders.
Fast and reliable hardware also minimizes costly errors. By instantly integrating key filters like volume and momentum, it reduces the chance of acting on false breakouts. When paired with indicators such as RSI or MACD, this speed ensures your charts reflect the latest market data, allowing you to seize opportunities the moment they arise.
Conclusion
Learning bullish chart patterns can be a game-changer when it comes to timing entries and managing risk. These patterns provide a window into market psychology, showing when buyers start to dominate the market. Spotting these setups early gives traders a solid advantage in capitalizing on upward price movements.
Traders who pair bullish patterns with volume and momentum filters report an average 12.3% boost in annual returns compared to those who skip chart analysis altogether. This data highlights how combining chart patterns with other tools like volume and momentum can significantly enhance trading results. While these patterns aren’t a guarantee of success, they increase the odds of making better trading decisions when used properly.
"Seasoned traders don’t treat chart patterns as a static ‘buy or sell’ recipe. Instead, they continuously monitor confluence between the pattern, momentum oscillators, and macro market context to confirm a trade thesis." – Brady Young, Marketing Specialist, LuxAlgo
Once you’ve mastered these patterns, having high-speed hardware becomes essential for acting on signals instantly. Technical skills are just one part of the equation – powerful hardware ensures you can respond to opportunities as they arise. Whether it’s running algorithmic scanners across multiple timeframes or monitoring several charts at once, processing power is what allows you to catch breakouts in real time.
The combination of sharp analysis and reliable technology creates a stronger edge in the market. It equips you with the ability to identify high-probability setups and execute trades without hesitation. Whether you’re observing a double bottom forming live or waiting for volume confirmation on an ascending triangle breakout, the right tools ensure you’re prepared to seize every opportunity.
FAQs
Why is volume confirmation important when analyzing bullish chart patterns?
Volume confirmation plays a crucial role in verifying bullish chart patterns. When a breakout is accompanied by increased trading volume, it signals heightened buying activity and stronger market interest. This added momentum makes the pattern more dependable and boosts the chances of an upward price move.
A rise in volume during a breakout shows that more traders are getting involved, which strengthens the bullish signal. On the other hand, if the breakout happens without a noticeable increase in volume, it might lack the strength to sustain and could potentially fail. Watching volume closely can be a powerful tool to bolster your confidence in making trading decisions.
How does trading hardware impact the ability to recognize bullish chart patterns?
When it comes to spotting bullish chart patterns like the ascending triangle, cup and handle, or bull flag, having the right tools isn’t just helpful – it can make a big difference. Beyond understanding these patterns, the hardware you use can significantly impact how effectively you analyze and act on market opportunities.
Take a high-performance trading PC, for instance. It ensures you can run multiple trading platforms and analyze real-time data without any lag. Pair that with a multi-monitor setup, and you can keep an eye on several charts and timeframes at once. Add a fast, low-latency internet connection to the mix, and you’re all set to respond to market movements in real time.
Investing in dependable hardware isn’t just about convenience – it can sharpen your ability to recognize patterns quickly and execute trades with accuracy. In a fast-paced market, this edge can be invaluable.
How can I calculate profit targets for bullish chart patterns?
To determine a profit target after a bullish breakout from a chart pattern, traders often use a straightforward method: measure the height of the pattern (the vertical distance between key points) and add that to the breakout price. Here’s a closer look at how this works for various patterns:
- Ascending Triangle, Flag, or Pennant: Find the height by measuring from the top resistance line (or the flag/pennant high) down to the base trendline. Add this height to the breakout price. For instance, if the top of the flag is $150 and the base is $140, the height is $10. A breakout above $150 would suggest a target of $160.
- Cup and Handle: Measure the depth of the cup by subtracting the low point of the cup from the rim (resistance level). Add this depth to the breakout price at the top of the handle. For example, if the rim is $85 and the cup’s low is $70, the depth is $15. A breakout above $85 would indicate a target around $100.
- Double or Triple Bottom: Measure the distance between the trough(s) and the peak. Add this height to the breakout price above the peak. For example, if the troughs are at $45 and the peak is $55, the height is $10. A breakout above $55 would project a target of $65.
This approach provides traders with a consistent way to estimate profit targets while keeping risk-reward ratios in check. All prices mentioned are in U.S. dollars (e.g., $1,250.00).


