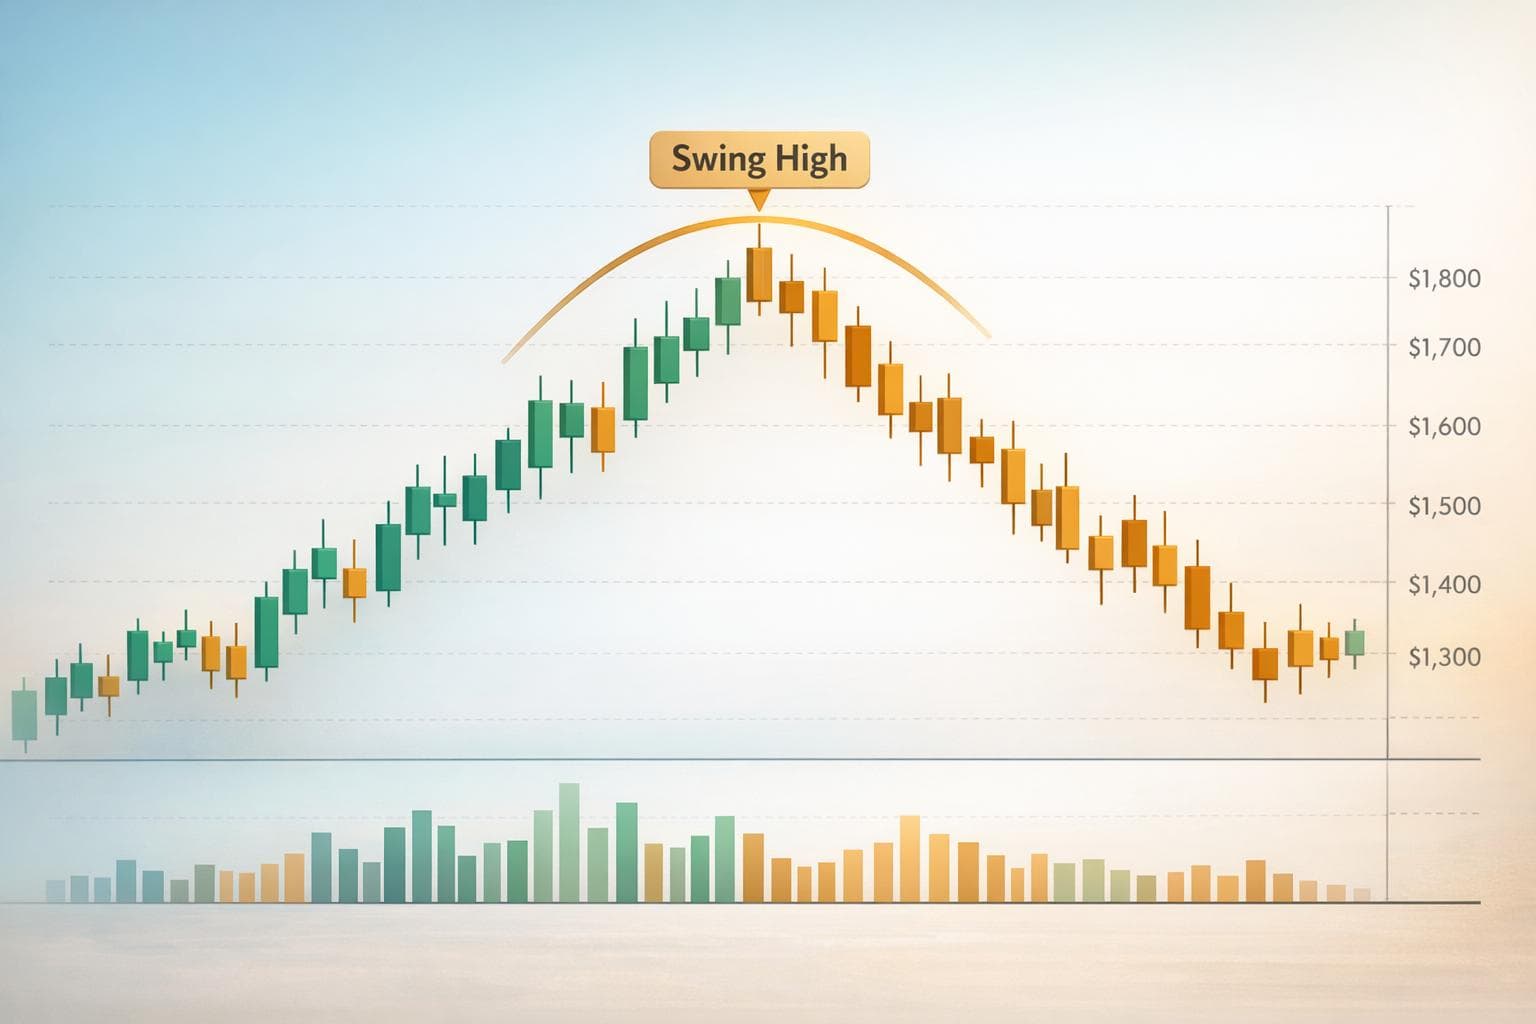
A swing high is the point on a price chart where an asset’s upward momentum slows, peaks, and then reverses downward. It’s like a mountain peak on the chart, often marking resistance levels where prices struggle to go higher. Identifying swing highs is crucial for understanding market trends, spotting reversals, and managing risk effectively.
Here’s what you need to know:
- Definition: A swing high is a price peak surrounded by lower highs on both sides.
- Patterns: A 5-bar or 3-bar candlestick pattern helps identify swing highs. The middle candle shows the peak.
- Role: Swing highs act as resistance levels, signal trend strength, and help time entries/exits.
- Strategies:
- Short positions can be entered at swing highs in a downtrend.
- Combine swing high analysis with tools like RSI or moving averages for better accuracy.
- Multiple Timeframes: Use higher timeframes for trend analysis and lower ones for precise trade entries.
Swing highs are not always reliable, with a failure rate of 40–60%, so pairing them with other technical tools is essential. Advanced trading setups and computers can also improve analysis efficiency.
How To Identify Swing Highs & Lows (Only Top 5% Of Traders Know How This Works)
What Is a Swing High?
A swing high occurs when an asset’s price reaches a peak that stands out above the surrounding highs on a chart, signaling the point where upward momentum slows and selling pressure begins to dominate. Think of it as the top of a small mountain, where the climb halts, and the descent begins. This peak often acts as a resistance level – a kind of ceiling that future price movements may struggle to surpass.
Swing highs aren’t random; they’re part of a larger pattern of peaks and valleys that outline the market’s structure. These patterns help traders identify whether an asset is trending up, down, or moving sideways. Understanding what defines a swing high is essential for spotting these patterns and interpreting market behavior.
Key Characteristics of Swing Highs
One of the most reliable ways to identify a swing high is through a 5-bar pattern. In this setup, the middle candle forms the highest peak, flanked by two lower candles on each side. For those seeking quicker signals, a 3-candle pattern can be used, though it sacrifices some accuracy.
"Swing highs and lows are usually determined using candlestick charts… These points represent potential points where price may bounce from (support or resistance levels)" – Shane Daly, Technical Analyst at Netpicks
The wicks of the candles, rather than their bodies, define the absolute peak of a swing high. These wicks show the highest price level that was rejected during trading. For a swing high to indicate a meaningful change in market structure, the price must eventually break and close beyond the previous level with the body of a candle. If the price only briefly wicks above a prior swing high without a corresponding close, traders often interpret it as a liquidity sweep – a false breakout designed to trigger stop-loss orders before the price reverses.
How to Identify Swing Highs on Price Charts
Spotting swing highs on price charts is all about observing how prices behave around previous peaks. Mastering this skill is essential for recognizing resistance levels and making well-timed trades. Below, we break down some practical ways to pinpoint these market turning points.
Using Candlestick Patterns
One of the simplest techniques involves the three-candle pattern: look for a middle candle that hits the highest point, flanked by one candle on each side with lower highs. For a more refined approach, the five-candle rule (also known as a fractal) comes into play. This method highlights significant turning points by requiring two candles with lower highs on each side of the peak candle, effectively filtering out minor price noise.
"A swing high is a price point where an upward move pauses, loses strength, and begins to turn downward." – Rosemary Ekong, Financial Writer
Many trading platforms offer built-in fractal indicators that automatically identify these patterns. However, keep in mind that these indicators usually lag by two candles, as they rely on subsequent price movements for confirmation. When dealing with false breakouts, pay close attention to candlestick wicks. Long wicks above a previous swing high, without a corresponding body close, often indicate rejection at key levels rather than a true breakout.
Analyzing Multiple Timeframes
To get a clearer picture, it’s crucial to analyze swing highs across different timeframes. This approach helps ensure your trades align with the broader market trend. Here’s a quick summary of how to use various timeframes effectively:
| Timeframe | Primary Purpose | Key Action |
|---|---|---|
| Monthly/Weekly | Trend Identification | Check if the market is in a Stage 2 Uptrend or undergoing a correction |
| Daily | Pattern Recognition | Spot swing highs, flags, or reversal patterns |
| 30/65-Minute | Execution | Fine-tune entry points to capture reversals while minimizing risk |
"Utilizing various timeframes enables traders to synchronize their trades with the overall market trend on higher timeframes while using lower timeframes to fine-tune entry and exit points." – Nick Schmidt, Co-founder, TraderLion
When working across multiple timeframes, it’s vital to wait for confirmation before acting on a swing high. Specifically, a strong candle close below the peak’s low offers the structural confirmation needed to validate the swing high. This disciplined approach helps reduce false signals and ensures consistent technical analysis, even in unpredictable market conditions.
sbb-itb-24dd98f
Role of Swing Highs in Price Action and Technical Analysis

Market Structure Patterns: Swing Highs and Lows in Trading Trends
Swing highs play a crucial role in identifying market turning points by highlighting areas where selling pressure increases. These levels can provide valuable insights for timing entry and exit decisions.
Trend Reversals and Resistance Levels
Swing highs often serve as natural resistance points, marking areas where selling pressure intensifies.
"Swing highs… often act like invisible ceilings, or resistance levels." – Anzél Killian, Financial Writer, IG
When the price struggles to break above a previous swing high, it reinforces the resistance level and may hint at a potential reversal. On the flip side, a confirmed close above the swing high signals a continuation of the uptrend. However, if only the wick of the candle breaks the level, it could indicate a liquidity sweep aimed at triggering stop-loss orders. Institutional traders frequently use these zones to execute large orders, creating sudden price shifts that can catch retail traders off guard. This reinforces the importance of confirming swing highs as part of a consistent market analysis approach.
Measuring Trend Strength
Swing highs are not just resistance markers – they also offer insights into the strength of ongoing trends. By analyzing the pattern of swing highs, you can gauge whether a trend is gaining momentum or starting to weaken. For instance, a consistent series of higher highs (HH) reflects strong bullish momentum, while lower highs (LH) suggest fading buying pressure and the possibility of a bearish reversal.
The relationship between swing highs and market structure helps traders identify the prevailing sentiment:
| Market Structure | Pattern | Sentiment |
|---|---|---|
| Uptrend | Higher Highs (HH) + Higher Lows (HL) | Bullish / Strong Buying Pressure |
| Downtrend | Lower Highs (LH) + Lower Lows (LL) | Bearish / Strong Selling Pressure |
| Trend Reversal (Bearish) | Failure to form a HH; break of previous HL | Shift from Bullish to Bearish |
Recognizing these patterns enables traders to better understand market dynamics and make informed decisions.
Trading Strategies Using Swing Highs
Swing highs play a crucial role in identifying resistance levels and tracking trends, and these strategies show how to turn those insights into actionable trading decisions.
Short Entries at Swing Highs
When trading in a downtrend, short positions can be initiated at swing highs. The key is to wait for the price to peak and begin its descent before entering. To safeguard your position, set a stop-loss 7–20 pips above the swing high to account for potential false breakouts. For profit targets, aim for a previous swing low or a well-established support level. For example, in a EUR/GBP trade, a trader placed a stop-loss just above the swing high and targeted the 161.8 Fibonacci extension, leading to a successful trade outcome.
"If you are consistently entering trades from the wrong swing point areas, then the chances are you will be entering against the big money."
– Johnathon Fox, Forex and Futures Trader, Forex School Online
Combining Swing Highs with Indicators
To refine your trade entries, combine swing high analysis with technical indicators. Moving averages can confirm the overall downtrend, while tools like RSI and Stochastics help identify overbought conditions. These indicators can signal when to enter a short trade, particularly when paired with multi-timeframe analysis for added accuracy.
"In a downtrend, a cross out of overbought territory… might be a signal to enter a short trade, while an oversold signal may be a signal to exit the short trade."
– Shaun Murison, Senior Market Analyst, IG
For instance, in a GBP/JPY trade, a trader identified a downtrend on the daily chart and then zoomed into the 4-hour timeframe. There, they spotted a swing high at a key resistance level, confirmed by a pin bar reversal, which provided a precise entry signal. This layered approach helps ensure trades align with the broader market trend.
How High-Performance Trading Computers Help
Analyzing swing highs across multiple timeframes demands powerful hardware and efficient setups. High-performance trading computers, like those from DayTradingComputers, are designed for this purpose. For example:
- Lite model: Priced at $3,569.00, equipped with 32GB DDR5 RAM, this model supports basic multi-timeframe analysis across several monitors.
- Ultra model: At $5,569.00, this system features 128GB DDR5 RAM and an AMD Ryzen 9800X3D processor, making it ideal for handling complex indicator setups and automated scripts in real time.
For traders who backtest large datasets or need to react quickly during volatile reversals, robust systems are critical. These setups also reduce the risk of slippage, ensuring stop-loss orders execute as intended when swing highs are breached.
Conclusion
Grasping the concept of swing highs can elevate your approach to technical analysis and trading. These price peaks go beyond basic chart patterns – they signal trend direction, hint at potential reversals, and serve as objective markers for managing risk. By zeroing in on candlestick wicks instead of bodies, you can pinpoint where buying momentum fades and selling pressure takes over.
Swing highs have practical uses that every trader can appreciate. They define resistance levels, help you steer clear of buying at inflated prices, and offer logical spots for placing stop-loss orders just above the peak. Pairing swing high analysis with tools like RSI or moving averages can make your strategy even more dependable. Research shows that trade failure rates at prior swing points often fall between 40% and 60%, depending on market conditions.
To make the most of these strategies, having the right technology is key. Advanced tools, such as K-means clustering and multi-timeframe analysis, demand powerful hardware for real-time performance. This is where systems like DayTradingComputers’ Lite and Ultra models come in. These machines provide the speed and processing power necessary to confirm swing highs without delays, whether you’re analyzing historical data or responding to rapid market shifts. With the right hardware, your trading decisions can keep pace with real-time market movements, ensuring precision and efficiency.
FAQs
How can I use swing highs with other technical indicators to improve my trading strategy?
Swing highs mark the peak of a price movement before the market turns downward. They’re a sign that buying pressure has eased, but when paired with other technical tools, they can offer more reliable trading insights.
Take moving averages like the 20- or 50-period EMA, for instance. If the price dips below a swing high and also crosses under the moving average, it could signal a downtrend and open up a short-selling opportunity. Adding a momentum indicator – such as RSI or MACD – can strengthen your analysis. For example, a swing high combined with an overbought RSI or a bearish MACD crossover makes a reversal more likely.
Swing highs also play a key role in Fibonacci retracements. By setting the swing high as the 100% level, you can observe how the price interacts with retracement levels like 61.8% or 78.6%. These levels often act as resistance zones, giving you a clearer picture for planning entry and exit points. When you combine swing highs with tools for trend, momentum, and Fibonacci analysis, you can build more precise and effective trading strategies.
What are the common mistakes traders make when identifying swing highs on price charts?
Traders often mistake a brief price spike for a genuine swing high, which can lead to entering trades too early. When this happens, the price might reverse quickly, failing to confirm the high as a resistance level. A true swing high is the highest point in a price movement, and subsequent candles should not break above it.
Another frequent error is overlooking the bigger picture, such as skipping the need for a clear pullback before the peak. Without this pullback, traders may fall for misleading signals, which can hurt the accuracy of their analysis. To improve your trading decisions, always evaluate the broader trend and ensure the swing high fits into a clear and well-formed price action pattern.
How does using multiple timeframes improve the accuracy of identifying swing highs?
Analyzing swing highs across multiple timeframes allows traders to determine whether a price peak represents a solid resistance level or just short-term market noise. For instance, if a swing high shows up on both a 15-minute chart and a daily chart, it suggests a stronger resistance point, one less likely to be influenced by random price movements. Conversely, a peak visible only on a lower timeframe often fades when viewed on a higher timeframe, indicating it might not be dependable.
This technique ties into the fractal nature of financial markets, where smaller patterns are nested within larger trends. By confirming a swing high on higher timeframes, traders can ensure it aligns with the broader market trend, minimizing the chances of trading against the prevailing momentum. This approach improves the precision of entry, exit, and stop-loss levels, enabling traders to make more calculated and confident decisions.


