
TradingView and ProRealTime are two of the most popular platforms for charting and analyzing financial markets. Here’s a quick breakdown to help you decide:
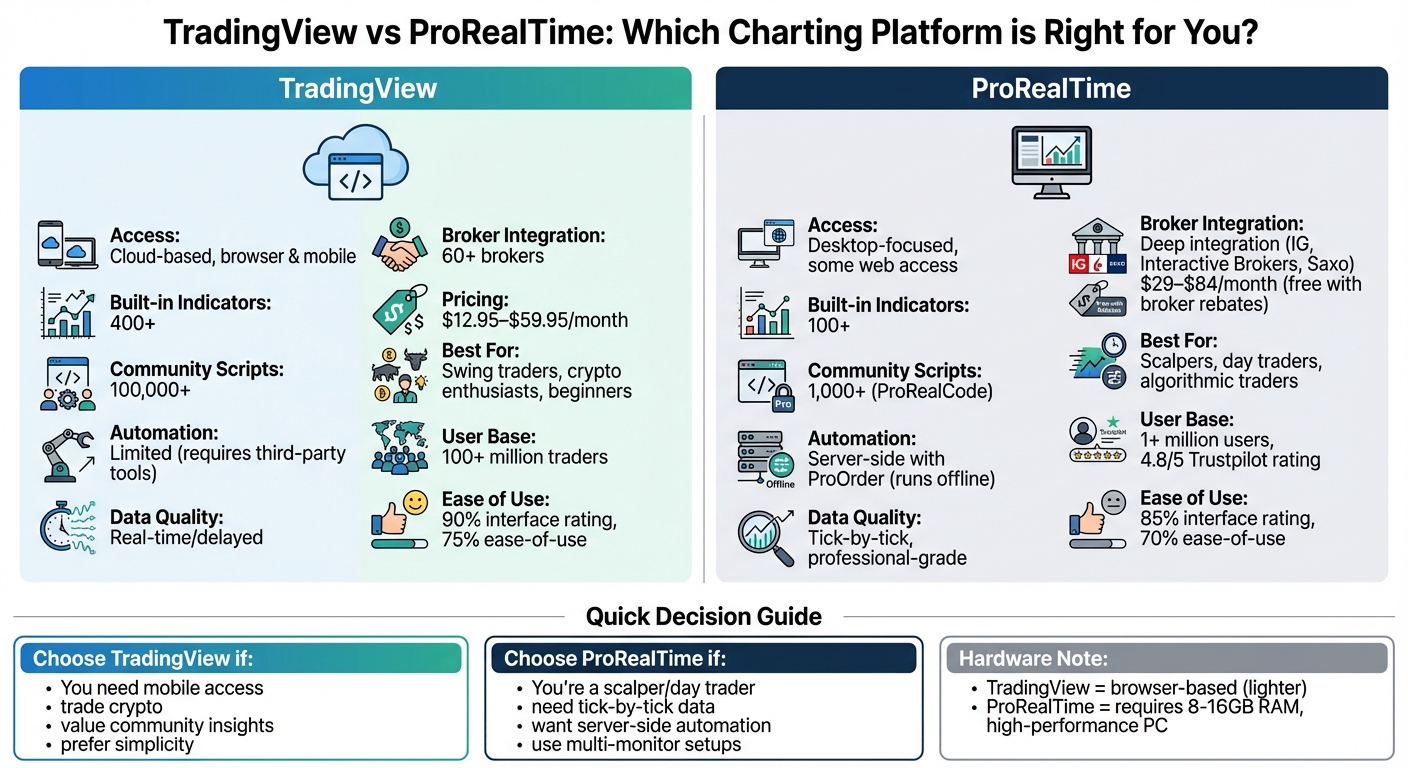
- TradingView: Ideal for traders who value web-based access, community-driven tools, and a modern interface. It offers over 400 built-in indicators, 100,000+ user scripts, and supports multiple asset classes like stocks, forex, and crypto. Best for beginners and swing traders.
- ProRealTime: Designed for professionals who need precision, tick-by-tick data, and advanced automation. It excels in multi-monitor setups, server-side execution, and deep broker integration. Perfect for scalpers, day traders, and algorithmic traders.
Quick Comparison
| Feature | TradingView | ProRealTime |
|---|---|---|
| Access | Cloud-based, browser & mobile | Desktop-focused, some web access |
| Indicators | 400+ built-in, 100,000+ community | 100+ built-in, custom ProBuilder |
| Automation | Limited, requires third-party tools | Server-side with ProOrder |
| Data Quality | Real-time/delayed | Tick-by-tick, professional-grade |
| Best For | Swing traders, crypto enthusiasts | Scalpers, algorithmic traders |
| Pricing | $12.95–$59.95/month | $29–$84/month (or free with brokers) |
Key Takeaway: Choose TradingView for simplicity and community insights. Opt for ProRealTime if you need advanced tools and institutional-level data.
TradingView vs ProRealTime: Feature Comparison Chart for Traders
TradingView: Features and Capabilities
Cloud-Based Access Across Devices
TradingView operates directly in your browser, making it accessible from virtually any device – desktop, laptop, tablet, or smartphone – without the need for local installations. Your alerts, watchlists, and custom Pine Script indicators sync instantly across platforms, ensuring you can easily switch between devices. For example, you can check an alert on your phone and pick up right where you left off on your multi-monitor desktop setup.
As Cedric Thompson, CMT, CFA, puts it:
"TradingView generally sets a high bar for web and mobile access. Its browser platform is zippy and does a fantastic job of mirroring the desktop experience, making it easy to hop between devices."
The mobile app retains all the core features, including drawing tools, multi-chart views, and reliable alerts, allowing you to monitor your positions even when you’re away from your desk. Beyond its accessibility, TradingView stands out for its powerful charting tools tailored for detailed analysis.
Charting Tools and Technical Indicators
Once you’re set up, TradingView offers an impressive array of charting tools designed for technical analysis. The platform includes over 400 built-in indicators – covering everything from Moving Averages and RSI to Bollinger Bands and Ichimoku Cloud. On top of that, users can tap into a library of more than 100,000 community-contributed scripts, all created with Pine Script, TradingView’s proprietary programming language.
Pine Script enables users to design and customize their own indicators and strategies. Jake McMahon, Head of Growth at Gainify, highlights this unique feature:
"What truly distinguishes TradingView from other stock charting software is its Pine Script programming language… you will be able to create fully customized indicators and strategies."
The platform also provides professional-grade drawing tools like Fibonacci Retracements, Gann fans, and trend lines, which are essential for identifying support, resistance, and potential reversals. The Compare Tool lets you overlay multiple symbols on the same chart, making it easy to benchmark a stock against the S&P 500 or analyze correlations between assets. Additionally, the Technical Ratings feature aggregates signals from 26 indicators (15 moving averages and 11 oscillators) into a single "Buy", "Strong Buy", "Sell", or "Neutral" rating.
| Indicator Category | Key Examples | Primary Use |
|---|---|---|
| Trend | Moving Averages, Ichimoku Cloud, Supertrend | Identifying market direction and support/resistance |
| Momentum | RSI, MACD, Stochastic Oscillator | Measuring price speed and overbought/oversold levels |
| Volatility | Bollinger Bands, Average True Range (ATR) | Evaluating market risk and setting stop-loss levels |
| Volume | On-Balance Volume (OBV), Volume Profile | Confirming price moves and spotting liquidity zones |
The number of indicators you can stack on a single chart depends on your subscription: the free plan allows 2, Essential ($14.95/month) supports 5, Plus ($29.95/month) allows 10, and Premium ($59.95/month) lets you use up to 25.
Community Features and Shared Ideas
TradingView boasts a user base of over 100 million traders worldwide. Every day, users publish approximately 5,300 market analyses – roughly 4 per minute – resulting in over 15.4 million publications on the platform. This collaborative environment exposes traders to a wide range of perspectives and insights, helping them refine their strategies and avoid personal biases.
The "Minds" feature offers symbol-specific social feeds where traders discuss assets in real time. You can follow top contributors to curate a personalized feed. Moderators enforce "House Rules" to maintain a professional and constructive atmosphere, filtering out spam and plagiarism.
The 100,000+ community scripts are open-source, allowing users to review code, ask questions, and even collaborate on strategy improvements. Before diving into custom coding, you can search the "Community" tab to see if someone has already created the indicator or strategy you need. TradingView also hosts "The Leap", a competition where users test their strategies in a simulated environment for real-money prizes.
Supported Markets and Broker Connections
TradingView provides quotes for over 500,000 financial instruments, including stocks, forex, cryptocurrencies, indices, futures, and CFDs. The platform integrates with more than 60 brokers, such as OANDA, TradeStation, and Forex.com, enabling you to place trades directly from your charts without switching between platforms.
Data availability depends on your subscription level. Free users typically receive delayed data for U.S. stocks, while paid plans offer real-time feeds. For cryptocurrency traders, the platform includes specialized scripts like Liquidation Heatmaps, which are particularly useful in high-volatility markets. Charting options range from standard formats like Candlestick and Bar charts to advanced types such as Heikin-Ashi, Renko, Point & Figure, and Kagi.
Performance on Multi-Monitor Trading Setups
TradingView’s browser-based platform is optimized for high-performance setups, making it ideal for traders using multiple monitors. Its lightweight design ensures smooth performance, even when managing multiple charts across several screens, without causing lag or slowdowns.
Tradingview vs Prorealtime: Honest review

ProRealTime: Features and Capabilities
ProRealTime stands apart from TradingView with its focus on desktop performance and precision. While it offers a web version, its true strength lies in its downloadable application, tailored for traders seeking professional-grade tools and direct market access. With 24 years of expertise in datafeed management and connections to over 17,000 global markets, the platform is designed for advanced traders who prioritize speed and control.
Currently, ProRealTime serves over one million users worldwide, earning a 4.8/5 star rating on Trustpilot from 652 reviews. Maxime Parra, Founder & Editor-in-Chief at NewTrading, praises the platform, stating:
"ProRealTime’s powerful software, paired with top-tier execution from leading brokers, makes it one of the best trading platforms out there."
Built for desktop use, ProRealTime takes full advantage of your computer’s processing power for complex analysis and automated trading. It supports advanced order types and execution strategies through select brokers, going well beyond basic buy and sell functionalities.
Desktop-Focused Design and Workspace Customization
ProRealTime’s desktop application is optimized for multi-monitor setups, allowing traders to arrange tiled, customizable windows across several screens. The Premium version supports up to 100 simultaneous charts and 100 distinct workspaces, while the Complete version accommodates 20 charts and 50 workspaces.
Each workspace operates as a standalone trading environment. For instance, you could create a "Dark Mode" setup for high-intensity scalping and a "Light Mode" layout for long-term analysis, switching between them instantly. The toolbar is completely customizable – you can drag and drop tools, remove unused features, and set up keyboard shortcuts for quicker execution. Indicator panels can also be resized, temporarily maximized, or reorganized using a "swap" feature. Additionally, trading hours and time zones can be adjusted for specific markets, ensuring alignment with exchange openings like London or New York.
Charting Tools and Analysis Features
The platform offers extensive customization options, enhancing its analytical capabilities. Traders can choose from over 15 chart styles, including traditional candlestick and bar charts, as well as advanced formats like Renko, Kagi, and Market Profile®. These specialized charts help filter out market noise by focusing on price movements instead of time intervals.
ProRealTime includes 100+ built-in technical indicators and lets users create custom ones through its proprietary ProBuilder language. Unlike TradingView’s Pine Script, ProBuilder is specifically tailored for strategy development and automation. You can even import indicators created by other users to expand your toolkit.
The ProRealTrend feature automatically identifies and updates horizontal and oblique support and resistance lines every five minutes, saving time during fast-moving markets. Additional tools include 40+ drawing options, such as Fibonacci retracements, Gann tools, Andrew’s pitchfork, and Raff channels, all transferable across timeframes.
For volume analysis, the platform provides Volume Profile to visualize volume distribution by price level and Order Flow tools to detect large trades and gauge market sentiment. The Global Cursor feature synchronizes candlestick periods across all open timeframes, streamlining multi-timeframe analysis.
| Feature Category | Key Tools | Advanced Capability |
|---|---|---|
| Chart Styles | Candlestick, Renko, Kagi, Market Profile | Non-time-based views (ticks, volume) |
| Analysis | 100+ Indicators, ProRealTrend | ProBuilder coding for custom indicators |
| Scanning | ProScreener | Real-time, multi-timeframe market scans |
| Execution | Trading from charts, Order Book | Triple orders (entry, target, stop), oblique orders |
| Data | Push real-time data, Tick-by-tick | Direct exchange connectivity (no intermediaries) |
Automated Trading and Strategy Testing
ProRealTime’s ProBuilder, ProBacktest, and ProOrder tools simplify custom coding, server-side backtesting, and automated trade execution – even when offline. Server-side backtesting is up to 10 times faster than running tests on a personal computer, enabling traders to evaluate complex strategies using years of historical data without overloading their system. Since ProOrder strategies run on ProRealTime’s servers, trades continue to execute even if your computer is off or disconnected from the internet.
The ProScreener tool allows real-time market scans across stocks and forex based on custom criteria, including multi-timeframe conditions – all without requiring programming knowledge. For options traders, the platform includes a dedicated options chain window with Greeks analysis and a scenario tool to project profit/loss outcomes based on theoretical price changes.
Data Quality and Broker Integration
ProRealTime offers tick-by-tick data, ensuring every price change is captured as it happens. Its data infrastructure is built with redundancy to ensure uninterrupted service. While rendering long-term charts with non-aggregated tick data may demand more processing power, it provides the level of detail advanced traders need.
The platform integrates directly with brokers like Interactive Brokers, Saxo Bank, and IG, supporting advanced order types such as triple orders (entry, target, and stop-loss submitted simultaneously) and oblique orders that adjust price levels over time. The order book offers four display modes: Vertical (DOM), Scalping, Horizontal, and Best bid/ask.
IG Group describes the platform’s ideal user:
"If you’re an experienced trader who uses advanced technical analysis and wants to automate your dealing, ProRealTime gives you a fully customisable interface and trading experience."
For IG clients, ProRealTime is free for the first month and remains free with at least four trades per month; otherwise, it costs $40 monthly. Active traders with other brokers can often offset the software cost (typically $29–$84/month) by meeting a minimum trade volume, usually around 30 round-trip trades per month.
Hardware Requirements for Best Performance
To get the most out of ProRealTime, a high-performance trading PC is recommended. The platform suggests at least 8 GB of RAM for the Complete version and 16 GB for the Premium version. For optimal performance, a 64-bit operating system and 64-bit Java are required to allocate 4 GB or more of RAM to the application.
Performance depends on factors like RAM allocation, chart complexity, and data volume. A screen resolution of 1280×1024 or higher is necessary, with higher resolutions recommended for multi-monitor setups.
A wired internet connection is advised over Wi-Fi to ensure stability for the "Push" mode datafeed, which streams every tick in real time. The platform recommends a minimum download speed of 5 Mbps, with typical data usage around 45 MB per hour for users running several charts and lists simultaneously.
| Component | Minimum Requirement | Recommended (High Performance) |
|---|---|---|
| Operating System | Windows 7/8 or macOS 10.8 | Latest 64-bit Windows or macOS |
| RAM | 4 GB | 8 GB (Complete) / 16 GB (Premium) |
| Java | Java 1.8 (32-bit) | Java 64-bit |
This robust setup lays the groundwork for a detailed comparison with TradingView’s browser-based platform in the next section.
sbb-itb-24dd98f
TradingView vs ProRealTime: Direct Comparison
Now that we’ve broken down both platforms individually, let’s compare them head-to-head on the elements that matter most. From features to usability and performance, this section highlights the key differences to help you decide.
Feature Comparison Table
TradingView leans heavily into community-driven tools, while ProRealTime focuses on delivering professional-grade precision.
When it comes to automation, ProRealTime stands out with its ProOrder system. This server-side feature ensures strategies run even when your computer is off. By contrast, TradingView relies on your browser or app staying active, or you’ll need third-party integrations to achieve similar functionality.
Data quality is another area of distinction. ProRealTime provides tick-by-tick data directly from exchanges, offering unmatched detail for professional traders. TradingView, while offering global real-time and delayed data, may not meet the granular needs of advanced users.
| Feature | TradingView | ProRealTime |
|---|---|---|
| Built-in Indicators | 400+ | 100+ |
| Community Scripts | 100,000+ | 1,000+ (ProRealCode) |
| Scripting Language | Pine Script | ProBuilder/ProOrder |
| Automated Trends | Manual or community scripts | ProRealTrend (automatic) |
| Chart Types | Time-based and exotic (Renko, Kagi) | Time-based and non-time (tick, volume) |
| Data Quality | Global real-time/delayed | Tick-by-tick professional feeds |
| Broker Integration | 60+ brokers | Deep integration with IG, Interactive Brokers, Saxo |
| Pricing (Monthly) | $12.95–$199.95 | $29–$84 (often free with broker rebates) |
ProRealTime’s ProRealTrend feature is a time-saver, automatically drawing support and resistance lines across multiple timeframes. TradingView users, on the other hand, often rely on manual tools or community-created scripts for pattern recognition.
Ease of Use and Learning Requirements
Features aside, ease of use plays a big role in how quickly traders can get up to speed.
TradingView edges out ProRealTime in accessibility. As NewTrading.io points out:
"TradingView shines with its sleek, modern design and intuitive layout. Navigating between charts, indicators, and watchlists feels seamless."
The platform’s web-native design includes user-friendly tooltips and a robust social community, where beginners can find pre-made strategies and get advice. With over 60 million users worldwide, help is never far away.
ProRealTime, however, has a steeper learning curve, especially when it comes to setup and workspace customization. While it may take more time to master, professional traders often find the platform’s depth worth the investment.
For beginners, TradingView holds the advantage with an interface rating of 90% and an ease-of-use score of 75%, compared to ProRealTime’s 85% and 70%, respectively.
System Performance on Trading Hardware
System performance is another area where these platforms diverge.
TradingView offers both web-based and desktop applications. The desktop app is particularly noteworthy, as it uses your computer’s CPU and RAM directly, avoiding the resource drain caused by browser tabs. As Pineify notes:
"The desktop app is like having a dedicated command center. It runs on its own, separate from your browser, which means it’s not competing for resources with your 50 open tabs."
The desktop version also supports multi-monitor setups with "tab linking", allowing you to sync tickers across multiple screens seamlessly. With the Ultimate plan, you can display up to 16 charts per tab, and the app remains more stable than the browser version, unaffected by crashes.
ProRealTime, on the other hand, is built as a desktop client optimized for precision. It’s designed for traders with complex multi-monitor setups and even supports specialized hardware like the Stream Deck for instant order execution. Its ProScreener feature scans thousands of securities across markets in seconds, but this power comes with higher hardware demands. While ProRealTime’s tick-by-tick data processing can be resource-intensive, TradingView’s cloud-synced approach handles complex indicators more efficiently without overloading your system.
Which Platform Works Best for Each Market
Each type of trading requires specific tools and data accuracy, and both TradingView and ProRealTime cater to different needs across asset classes.
Stocks and ETFs
When it comes to US stocks and ETFs, ProRealTime stands out with its institutional-grade, tick-by-tick data sourced directly from exchanges. This level of precision is perfect for scalpers and day traders who rely on split-second accuracy. On the other hand, TradingView offers an extensive selection of 400+ built-in indicators and access to over 100,000 community-created scripts, making it a strong choice for swing traders who don’t require tick-level data.
TradingView’s free tier includes real-time data from BATS, while ProRealTime charges a monthly fee starting at $6 per exchange for NASDAQ and NYSE feeds. Both platforms also support direct chart trading through major broker integrations. For active traders using ProRealTime’s partner brokers, there’s an added perk: the platform can be accessed for free through trade rebates, provided specific volume requirements are met.
Now, let’s see how these platforms perform in the fast-moving forex and futures markets.
Forex and Futures
For forex and futures traders, ProRealTime is a top choice, especially during periods of high volatility. Its non-time-based charts – like tick-by-tick, x-ticks, and x-volume – help eliminate market noise, focusing solely on price movements. Features like the Depth of Market (DOM) and a vertical order book provide futures traders with the detailed view needed for precise scalping strategies. Additionally, server-side execution ensures trades are executed reliably, even if your computer is offline.
For retail forex traders, TradingView offers seamless broker connectivity and adds value with its sentiment analysis tools, powered by its large user community. However, futures traders on TradingView should note that real-time data, such as Level II data at $13 per month, comes with extra fees.
Next, we’ll explore how these platforms handle the ever-active cryptocurrency market.
Cryptocurrency
When it comes to cryptocurrency trading, TradingView shines. As Jamie Holmes puts it:
"TradingView is perhaps the oldest and best charting platform for cryptocurrencies like Bitcoin and has attracted a large community of active traders."
TradingView supports nearly all crypto exchanges and altcoin pairs, offering specialized indicators tailored to the volatility of the crypto market. Its cloud-based design ensures you can monitor charts seamlessly across devices – an essential feature for the 24/7 nature of crypto trading.
ProRealTime, in contrast, provides crypto access mainly through broker integrations with IG, Interactive Brokers, and Saxo Bank. This makes it a better fit for traders managing cryptocurrencies alongside traditional assets. For systematic traders who rely on server-side automation via ProOrder, ProRealTime’s more structured, desktop-focused workflow might make sense. However, for swing traders or those prioritizing altcoin coverage and mobile convenience, TradingView’s Essential plan at $14.95 per month offers better flexibility and value.
How to Choose the Right Charting Software
Platform Recommendations by Trader Type
For discretionary traders, TradingView stands out with its user-friendly design and a vast library of community-created indicators. As Cedric Thompson CMT, CFA puts it:
"TradingView shines with its sleek, modern design and intuitive layout… making it a favorite among traders who value a clean and responsive workspace."
If you’re into algorithm development, ProRealTime offers an edge with its ProOrder feature, which allows strategies to run even offline. Day traders and scalpers will appreciate ProRealTime’s tick-by-tick data precision, essential for handling the fast pace of intraday trading. Meanwhile, swing traders can rely on TradingView for its straightforward tools that avoid the complexity of professional-grade platforms.
Once you’ve matched your trading style to a platform, it’s time to consider how your hardware setup can impact its performance.
Why High-Performance Trading PCs Matter
Your trading hardware is just as critical as the platform you choose. Each charting software has unique hardware requirements. For example, ProRealTime, a desktop-based tool, relies heavily on your CPU and RAM to handle its multi-window layouts and complex tasks. Its tick-by-tick data, delivered in "push mode", demands a high-performance system to keep up with real-time updates without lag. Additionally, ProRealTime supports hardware add-ons like the Stream Deck, offering physical controls for trading actions.
On the other hand, TradingView operates primarily in a browser, making its performance more dependent on a stable internet connection than raw computing power. However, if you’re managing multiple high-resolution charts across several monitors, a robust trading PC with sufficient RAM and a capable graphics card can enhance your experience. For ProRealTime’s Premium version, which supports up to 100 charts at once, a high-end trading setup becomes a necessity.
Final Recommendations
Your choice of charting software should align with both your trading style and your hardware capabilities. Opt for TradingView if you trade cryptocurrencies, need mobile access, or want to learn from community-generated insights. It’s particularly suited for U.S. traders working with brokers such as TradeStation, OANDA, or Interactive Brokers. For scalpers or those requiring institutional-grade data and server-side automation, ProRealTime is the better fit.
Regardless of the platform, optimized hardware makes a big difference. ProRealTime benefits greatly from multi-monitor setups and fast processors to handle its real-time data streams efficiently. TradingView, while browser-based, performs best when paired with systems equipped with sufficient RAM and graphics power to manage multiple chart layouts seamlessly.
FAQs
How do TradingView and ProRealTime compare in automation and data accuracy?
TradingView operates using its own Pine Script language for automation and supports integrations with third-party tools. However, it doesn’t offer built-in server-side automation. This means your strategies depend on your device staying active to function. On the flip side, ProRealTime includes server-side automation with its ProOrder feature, enabling strategies to run continuously without needing user input or a device to remain online.
In terms of data accuracy, ProRealTime delivers tick-by-tick data directly from exchanges, providing highly precise and dependable information. TradingView, in comparison, uses aggregated data feeds, which could lead to slight delays or occasional limitations. For traders who value precise data and seamless automation, ProRealTime might be the stronger option.
Which charting platform is more beginner-friendly: TradingView or ProRealTime?
For those just starting out, TradingView tends to be the go-to option. Its clean and intuitive interface makes it easy to use, even for beginners. Plus, the platform offers a variety of pre-built indicators and features an active community where users share ideas and strategies. These social aspects can speed up the learning process for new traders.
Meanwhile, ProRealTime caters more to seasoned traders who require advanced tools and extensive customization options. However, its interface can be a bit daunting for newcomers. If you’re taking your first steps into trading, TradingView offers a gentler introduction and a more approachable experience.
What are the advantages of TradingView’s community tools compared to ProRealTime’s professional features?
TradingView provides a vibrant space for traders to connect and collaborate through its community-driven features. Users can share and explore custom scripts, indicators, and trading ideas, creating an environment where discovering new strategies and learning from others becomes seamless. This makes it easier to adapt and refine analysis to suit individual trading styles.
On the other hand, ProRealTime leans heavily toward offering advanced tools for detailed technical analysis. While its features cater to professional-grade needs, it doesn’t emphasize community interaction as much. For traders who prioritize shared insights and collaboration, TradingView stands out as the more engaging option.


