A liquidity sweep happens when large market players, like institutions, intentionally move prices to trigger clusters of stop-loss orders or pending orders placed by retail traders. This tactic creates the liquidity they need to execute big trades efficiently. These moves often cause sharp reversals in price, leaving many retail traders at a loss while institutions profit.
Here’s what you need to know:
- Liquidity sweeps target areas with high concentrations of stop-loss orders, such as swing highs, swing lows, and key support or resistance levels.
- Stop hunts are a common method used to trigger these orders, often resulting in "fake breakouts" or "bull/bear traps."
- Buyside liquidity (above resistance) and sellside liquidity (below support) are key zones where these sweeps occur.
- Spotting liquidity sweeps can help traders avoid unnecessary losses and identify potential trade opportunities.
To trade effectively:
- Avoid placing stop-losses at obvious levels.
- Look for confirmation, like rejection candles, after a sweep before entering a trade.
- Focus on high-liquidity times, such as the London or New York market opens.
Understanding liquidity sweeps can help you align with institutional strategies instead of being caught off guard.
Master Liquidity Sweeps & Inducements (in 25 minutes)
How Stop Hunts Create Liquidity Sweeps
Stop hunts play a crucial role in driving liquidity sweeps. Institutional traders like banks, hedge funds, and market makers need substantial liquidity to execute their massive orders without causing excessive slippage or disrupting market prices. When natural liquidity is insufficient, they often turn to retail stop-loss orders to meet their needs. Here’s a closer look at how this process unfolds.
How Stop Hunts Work
Institutions intentionally target areas known as liquidity pools – zones where retail traders commonly cluster their stop-loss orders. These are often found at previous swing highs, swing lows, and critical support or resistance levels. Why these areas? Because many retail traders rely on similar technical analysis techniques, placing their stops at predictable, "obvious" levels.
When institutions drive prices toward these liquidity pools, stop-loss orders are triggered and immediately convert into market orders. This sudden influx of orders creates the liquidity institutions need to execute their large trades. After absorbing these orders, the price often reverses sharply, leaving behind long wicks or what traders call "fake breakouts" on the chart. In essence, institutions use retail traders’ exits as their entry points. For example, if the price dips below a support level, triggering sell-stop orders from long traders, institutions may use those sell orders to accumulate buy positions at lower prices before the market rebounds upward.
Market Manipulation Through Liquidity Collection
Expanding on this concept, institutions often exploit periods of low liquidity to stage deliberate price movements. Stop hunts aren’t random events; they’re part of carefully planned strategies designed to influence short-term price action. These tactics are especially effective during low-liquidity times, such as the Asian trading session, pre-market hours, or moments leading up to major news releases.
Institutions may also create bull traps and bear traps to manipulate the market further. In a bull trap, prices break above resistance levels, triggering buy-stop orders, only to reverse sharply afterward. Similarly, in a bear trap, prices dip below support levels, activating sell-stops before rebounding. These liquidity sweeps often align with key market events, such as the openings of the London and New York sessions or periods of heightened volatility before major news announcements. These times see increased retail activity, making them prime opportunities for institutions to execute their strategies.
How to Identify Liquidity Zones on Charts
Spotting liquidity zones on charts can help traders anticipate where institutions might trigger stop hunts. These zones are specific price levels where clusters of pending retail stop-loss and limit orders are concentrated. They act like magnets for price action, providing the liquidity that big players need to execute large trades without causing excessive slippage.
The most dependable liquidity zones share a few key traits. Focus on areas where the price has repeatedly stalled or consolidated without breaking through. Points of sharp rejection, where the price quickly bounced in the past, often signal strong liquidity buildup. Psychological levels, like round numbers ($100.00 in stocks or 1.2000 in forex), also tend to attract retail orders, making them prime targets for institutional activity.
"These zones are typically highlighted by a sudden surge or drop in price, leaving behind a footprint where future price often reacts." – FXOpen Author
When analyzing these zones, pay attention to how the price behaves. A telltale sign of a liquidity sweep is when the price briefly pierces a zone and then quickly reverses, leaving a long wick on the candlestick. This pattern indicates that stop orders have been triggered and absorbed by larger players. Liquidity zones identified on higher timeframes, such as 4-hour or daily charts, often carry more weight and can lead to significant price movements. To pinpoint these zones, look at historical price levels and psychological benchmarks that frequently act as magnets for price action.
Common Liquidity Zones
Some liquidity zones are easier to predict than others. Swing highs and swing lows – those peaks and valleys formed during regular price movements – are prime examples. Similarly, equal highs or equal lows, where the price repeatedly touches the same level without breaking it, tend to gather a large number of stop orders.
Support and resistance levels from prior trading sessions are also major liquidity zones. Key levels like the Prior Day High (PDH) and Prior Day Low (PDL) often come into play during the opening hours of major trading sessions. Fibonacci retracement areas, especially the 0.618 to 0.65 range (often called the "Golden Zone"), frequently align with these clusters, creating areas of confluence where liquidity sweeps and reversals are likely. Don’t forget psychological round numbers – levels like 1.2000, 1.3000, or 1.5000 in forex and $50.00, $100.00, or $200.00 in stocks are common targets for liquidity collection.
| Zone Type | Description | Examples |
|---|---|---|
| Fibonacci Zones | Based on retracement and extension levels | 0.382, 0.5, 0.618, 0.786 retracements |
| Psychological Zones | Levels tied to round numbers that attract trades | Round numbers like 1.2000 in forex or $80.00 in oil |
| Historic Zones | Significant past support or resistance levels | Key levels where price reacted previously |
| Dynamic Zones | Moving liquidity areas tied to trends | Rising/falling trend lines or moving averages (e.g., 50 SMA) |
Understanding these zones lays the foundation for distinguishing between buyside and sellside liquidity.
Buyside vs. Sellside Liquidity
Recognizing the difference between buyside liquidity (BSL) and sellside liquidity (SSL) can give traders a better sense of potential price sweeps and market direction. Buyside liquidity is found above resistance levels and swing highs, where buy-stop orders are placed by traders expecting a breakout or protecting short positions. Sellside liquidity, on the other hand, is located below support levels and swing lows, where sell-stop orders sit from traders protecting long positions.
When institutions target buyside liquidity, they sell into these triggered orders, often leading to a bearish reversal (commonly called a bull trap). Conversely, when they go after sellside liquidity, they buy into the triggered orders, frequently causing a bullish reversal (known as a bear trap).
| Feature | Buyside Liquidity (BSL) (Above Resistance) | Sellside Liquidity (SSL) (Below Support) |
|---|---|---|
| Location | Above resistance, swing highs, or double tops | Below support, swing lows, or double bottoms |
| Order Type | Buy-stop orders from short sellers’ stop-losses | Sell-stop orders from long traders’ stop-losses |
| Market Bias | Sweeps often lead to bearish reversals (bull trap) | Sweeps often lead to bullish reversals (bear trap) |
| Institutional Goal | To sell into triggered orders | To buy into triggered orders |
To trade effectively using these concepts, mark equal highs and lows on your charts as priority zones and wait for confirmation before entering a trade. Instead of jumping in right after a level is breached, look for a clear reversal signal. Higher timeframe liquidity zones are generally more reliable, as they attract greater institutional interest compared to those on lower timeframes.
sbb-itb-24dd98f
Example: How a Liquidity Sweep Unfolds
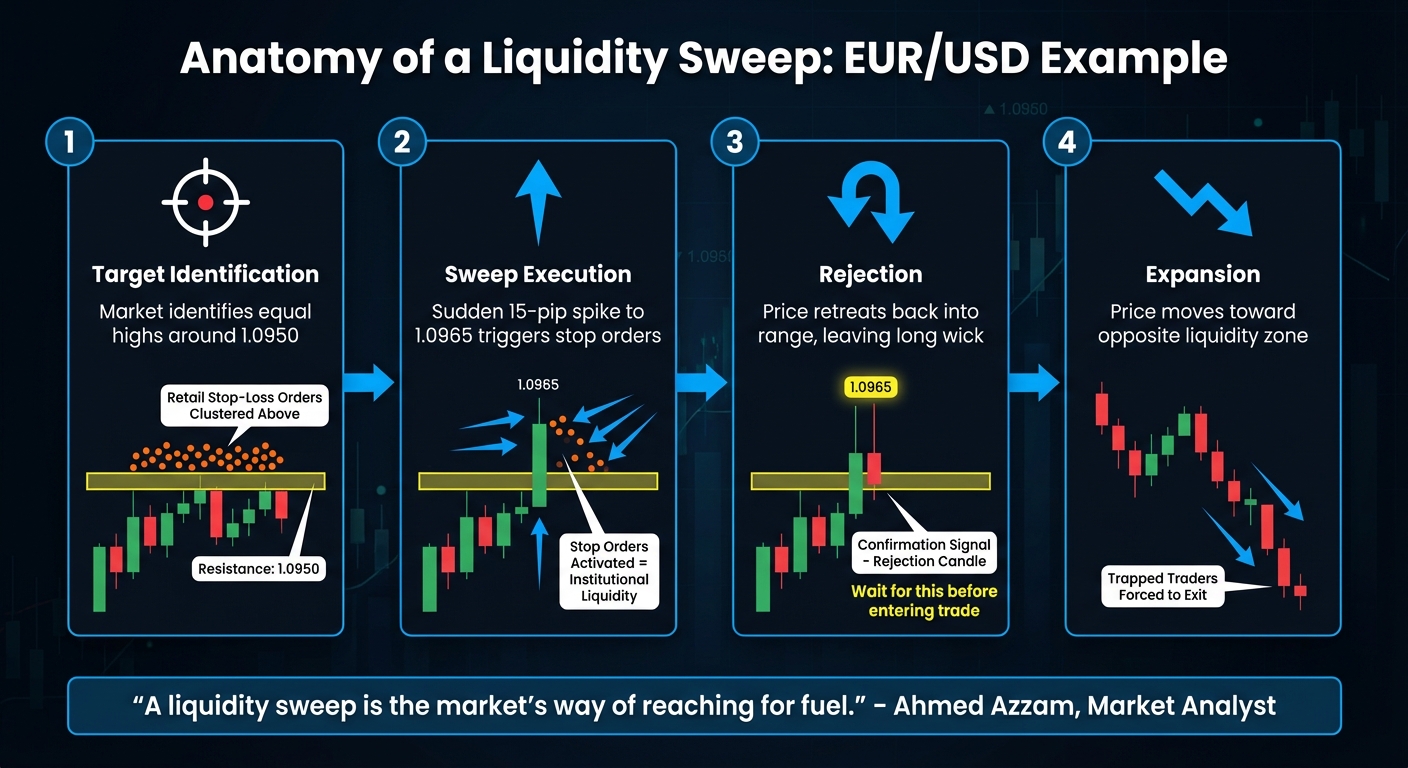
How Liquidity Sweeps Work: 4-Step Process from Target to Expansion
EUR/USD Liquidity Sweep Breakdown
Let’s break down an actual liquidity sweep in the EUR/USD currency pair. As highlighted by EBC Financial Group, the pair was trading within a narrow range, with resistance marked at 1.0950. This range corresponded to previously identified liquidity zones. Retail traders, expecting either a breakout or aiming to protect their short positions, placed stop-loss orders just above 1.0960 or buy-stop orders slightly above 1.0950.
Institutional players then stepped in, driving the price up to 1.0965. This move triggered a cluster of stop orders, providing the liquidity needed for their operations. However, instead of continuing upward as breakout traders anticipated, the price reversed sharply, falling back below the range. This sudden reversal trapped breakout buyers and forced short sellers out of their positions. It’s a textbook example of how institutional strategies can set the stage for price reversals.
Here’s how the process typically plays out:
- Target Identification: The market zeroes in on the equal highs around 1.0950.
- Sweep Execution: A sudden 15-pip spike to 1.0965 activates stop orders.
- Rejection: The price retreats back into the range, leaving a long candlestick wick. Smart traders often wait for this rejection candle as confirmation before entering short positions.
- Expansion: The price moves swiftly toward the opposite liquidity zone (sells below previous lows), as trapped traders are forced to close their positions.
"A liquidity sweep is the market’s way of reaching for fuel." – Ahmed Azzam, Market Analyst
Liquidity sweeps tend to be most effective during key trading sessions, like the London and New York opens, or following high-impact news events that cause volatility to surge. A sharp spike during the breach, combined with fading volume during the reversal, signals that institutional orders have been executed. By understanding the dynamics of a liquidity sweep, traders can better time their entries and exits, setting the stage for the strategies discussed next.
Trading Strategies for Liquidity Sweeps
Now that we’ve covered liquidity pools and stop hunts, let’s dive into practical strategies for trading liquidity sweeps.
Using Sweeps to Confirm Trends
Once you’ve identified liquidity zones, you can use sweeps to validate trend directions. Liquidity sweeps behave differently based on market direction: a sweep against the trend often signals a reversal, while one in the direction of the trend could be a continuation trap.
After a sweep, watch how the price reacts. A strong signal is when the price retraces and breaks back through the swept level, forming what’s known as a Break of Structure or Change of Character. This move becomes even more reliable when combined with areas like Order Blocks or Fair Value Gaps, which are commonly targeted by institutional traders. Many experienced traders aim for reward-to-risk ratios between 3:1 and 8:1 when trading these setups.
Avoid jumping in as soon as the price breaches a level. Instead, wait for a clear rejection candle – such as a pin bar or an engulfing pattern – that closes back into the previous range. A volume spike during the breach, followed by a drop as the price reverses, often indicates that institutional orders have been absorbed.
Trading Reversals at Liquidity Zones
Before the trading session starts, mark key liquidity zones like prior session highs and lows, session opens, equal highs and lows, and round numbers. The best entry point often comes after a confirmed rejection and a shift in market structure. Look for the first retracement candle following these signals to position your trade. Place your stop-loss just beyond the wick of the sweep, adding a small buffer based on the Average True Range (ATR).
Risk management is non-negotiable. Limit your risk to 1%–2% of your capital per trade, and use leverage conservatively – ideally no higher than 5:1.
"Liquidity sweeps are the auction’s stress tests. They reveal where stops and resting orders live and whether the market wants back into the range or onward into new territory." – Ahmed Azzam, Market Analyst, Equiti
Timing is also crucial. Focus on high-liquidity periods, such as the New York Open (8:30 AM – 10:30 AM EST) or the London Open, when institutional activity is at its peak.
Hardware for Fast Chart Analysis
To trade liquidity sweeps effectively, having the right hardware matters. These strategies depend on real-time analysis of order book data, volume, and tick-by-tick price movements, so quick action is key when a sweep triggers.
A multi-monitor setup can help you track higher-timeframe liquidity zones (like 1H, 4H, or Daily charts) while executing trades on lower timeframes (such as 1M, 5M, or 15M). This setup reduces mental strain during fast-moving markets and helps filter out unnecessary noise.
For traders looking to upgrade their hardware, DayTradingComputers offers tailored systems:
- Lite Plan: Priced at $3,569.00, this setup includes 32GB DDR5 RAM and a 1TB NVMe SSD, suitable for basic charting and swing trading.
- Pro Plan: At $4,569.00, this option features 64GB DDR5 RAM and a 2TB NVMe SSD, ideal for active day traders running real-time data analysis.
- Ultra Plan: Designed for high-frequency scalping, this $5,569.00 setup comes with 128GB DDR5 RAM and a 4TB NVMe SSD.
Fast hardware reduces the risk of slippage during rapid reversals and ensures smooth performance for critical tools like Fair Value Gaps and Order Blocks. These tools are invaluable for identifying confluence in sweep-based trading setups.
Conclusion
Liquidity sweeps are tactical moves by institutional traders designed to trigger clusters of stop-loss orders and execute large positions with minimal slippage. By learning to spot these patterns, you can align your trades with institutional strategies instead of becoming collateral damage.
This knowledge paves the way for more accurate trade entries. Look for confirmation signals – like a rejection candle, a fading volume spike, or a close back within the range – before jumping into a trade. Combining liquidity sweeps with other technical tools, such as Fair Value Gaps or Order Blocks, can help you build setups with higher odds of success.
"Understanding liquidity sweeps offers traders a critical lens through which to view market dynamics, revealing deeper insights into potential price movements." – LuxAlgo
Stick to disciplined risk management. Limit your risk to 1%–2% of your account per trade and avoid using leverage beyond 5:1. Place your stop-loss orders just outside the sweep zone, and consider using the Average True Range (ATR) as a buffer to safeguard your position. Trading during high-liquidity periods, like the New York Open, can also increase your chances of success since institutional activity tends to peak during these times.
With the right approach and tools, you can transform market manipulation into an opportunity. Start marking liquidity zones on your charts and practice spotting sweeps so you can stay ahead of the curve.
FAQs
How do I spot liquidity zones on a trading chart?
Liquidity zones are key areas on a chart where significant clusters of orders – like stop-losses or pending orders – are likely to be activated. These zones often show up just beyond recent swing highs or lows, near round-number price levels (think $1.2000 on the EUR/USD chart), or around areas of consolidation that lead to sharp price movements. When the price enters these zones, it often triggers a quick spike or wick before reversing direction, a phenomenon known as a liquidity sweep.
Here’s how you can spot these zones:
- Swing highs and lows: Identify the highest and lowest points of recent price action. The areas just beyond these levels tend to attract stop-loss orders.
- Order blocks: Pay attention to the last bullish or bearish candle before a strong price movement. These candles often highlight supply or demand zones.
- Round numbers: Whole-number price levels often act as magnets for concentrated orders.
Using these observations alongside tools like volume indicators or order-flow heatmaps can help you anticipate potential liquidity sweeps. This approach allows you to align your trades more effectively with institutional market activity.
How can I avoid being caught in a stop hunt during trading?
A stop hunt occurs when major market players intentionally push the price just past common stop-loss levels, causing retail traders to be forced out of their positions before the market reverses direction. These stop-loss orders tend to cluster in predictable areas, such as just below recent lows or above highs, making them easy targets for larger traders.
To avoid falling into this trap, try placing your stop-loss orders slightly beyond these obvious levels. Adding a volatility-based buffer can also help account for sudden price spikes. It’s wise to wait for clear price-action signals before entering a trade – like a candle closing beyond a breakout level or a successful retest of a key area. Another effective approach is aligning your trades with institutional liquidity flows, such as supply and demand zones, to better position yourself in the market. By combining these techniques, you can minimize the chances of being caught in a stop hunt and make more informed trading decisions.
What is a liquidity sweep, and how can traders use it to their advantage?
A liquidity sweep happens when big players in the market – like banks or hedge funds – push prices beyond important levels, such as support, resistance, or recent highs and lows. Why? To trigger clusters of stop-losses or pending orders. This tactic helps them gather the liquidity they need to execute large trades with minimal price slippage. After these orders are activated, the price often reverses direction as these institutions use the captured liquidity to enter or exit their main positions.
For traders, spotting these moves can be a game-changer. Look for sharp price spikes or "wicks" that break through key levels – these often signal a sweep. Instead of jumping into a trade right away, it’s smarter to wait for the reversal that typically follows. This reversal can offer a more dependable entry point. To fine-tune your strategy, consider using tools like volume indicators, order-flow heatmaps, or liquidity-zone markers. These can help you pinpoint potential sweep zones, improve your timing, and steer clear of getting caught in the initial price surge.


